Fig. 9
Download original image
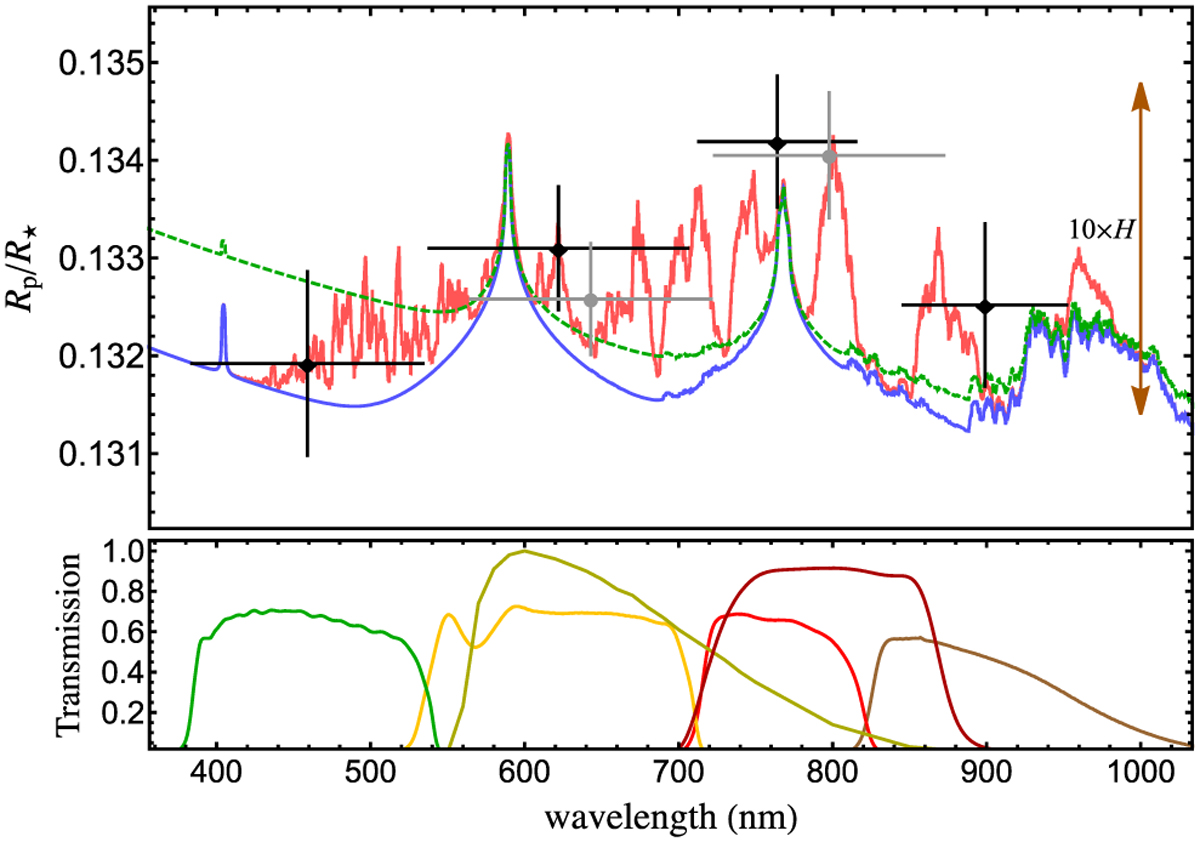
Top panel: variation in the planetary radius, in terms of the planet-to-star radius ratio, with wavelength. The points are from the ground-based transit observations presented in this work (black from the MPG 2.2 m telescope and grey from the Danish 1.54m telescope). The vertical bars represent the errors in the measurements and the horizontal bars show the FWHM transmission of the passbands used. The observational points are compared with three synthetic spectra from Fortney et al. (2010, Red: equilibrium-chemistry; Blue: no TiO, VO opacity; Green: enhanced Rayleigh scattering). The same offset is applied to all four models to provide the best fit to the measurements. The size of 10 atmospheric pressure scale heights (10 × H) is shown on the right of the plot. Bottom panel: transmission curves for the Bessell I and R filters and the total efficiencies of the GROND filters.
Current usage metrics show cumulative count of Article Views (full-text article views including HTML views, PDF and ePub downloads, according to the available data) and Abstracts Views on Vision4Press platform.
Data correspond to usage on the plateform after 2015. The current usage metrics is available 48-96 hours after online publication and is updated daily on week days.
Initial download of the metrics may take a while.