Fig. 7
Download original image
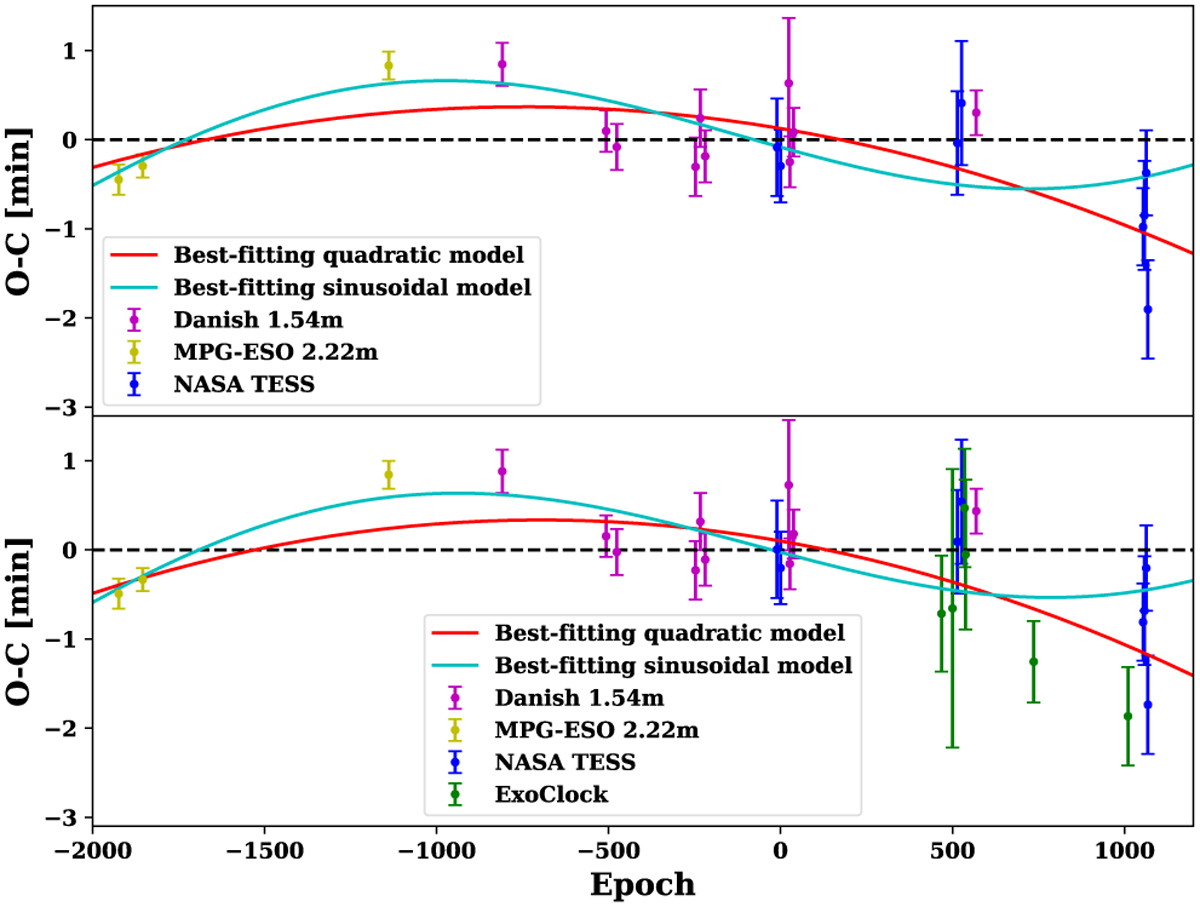
Top panel: O–C residuals for HATS-2b in the case (a), superimposed with the best-fitting linear ephemeris model (black line), the best-fitting quadratic ephemeris model (red line) and the best-fitting cosinusoidal ephemeris model (cyan line). The purple points represent the times derived from the Danish 1.54 m telescope observations, the yellow points the times derived from the MPG/ESO 2.2 m telescope data, and the blue points the times derived from TESS data. Bottom panel: same as the top panel but for case (b), i.e. also considering the data from the ExoClock database, which are represented as green points.
Current usage metrics show cumulative count of Article Views (full-text article views including HTML views, PDF and ePub downloads, according to the available data) and Abstracts Views on Vision4Press platform.
Data correspond to usage on the plateform after 2015. The current usage metrics is available 48-96 hours after online publication and is updated daily on week days.
Initial download of the metrics may take a while.