Fig. 5
Download original image
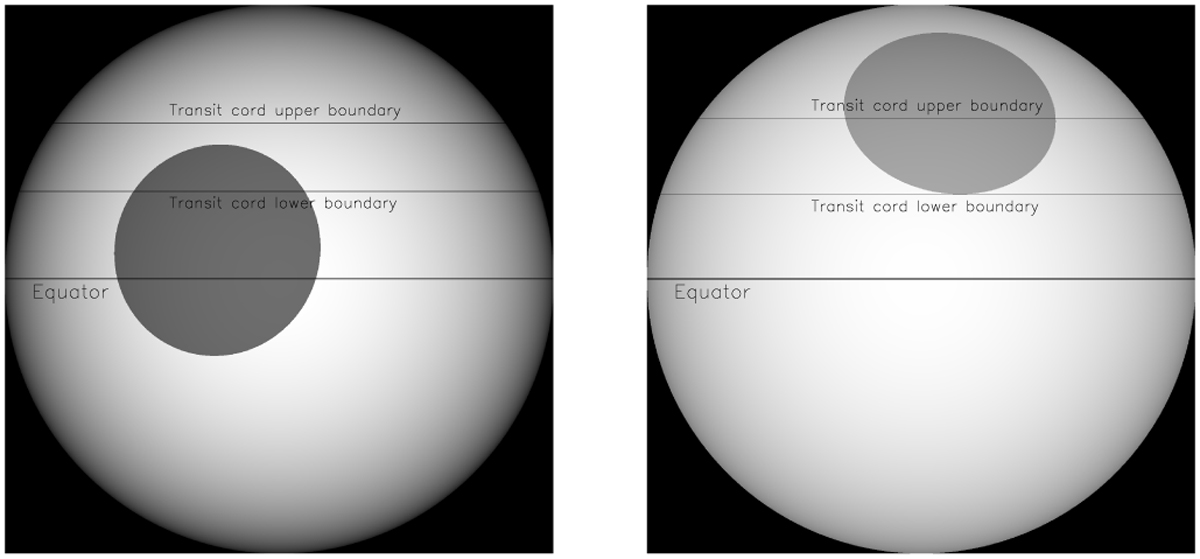
Representation of the stellar disc, starspot position, and transit chord for the two consecutive transit events, #7 (left panel) and #8 (right panel) with starspot crossings, obtained using PRISM/GEMC. The grey scale of each starspot is related to its contrast. The starspot properties refer to the best-fitting models in Fig. A.2 (see Appendix).
Current usage metrics show cumulative count of Article Views (full-text article views including HTML views, PDF and ePub downloads, according to the available data) and Abstracts Views on Vision4Press platform.
Data correspond to usage on the plateform after 2015. The current usage metrics is available 48-96 hours after online publication and is updated daily on week days.
Initial download of the metrics may take a while.