Fig. C.1
Download original image
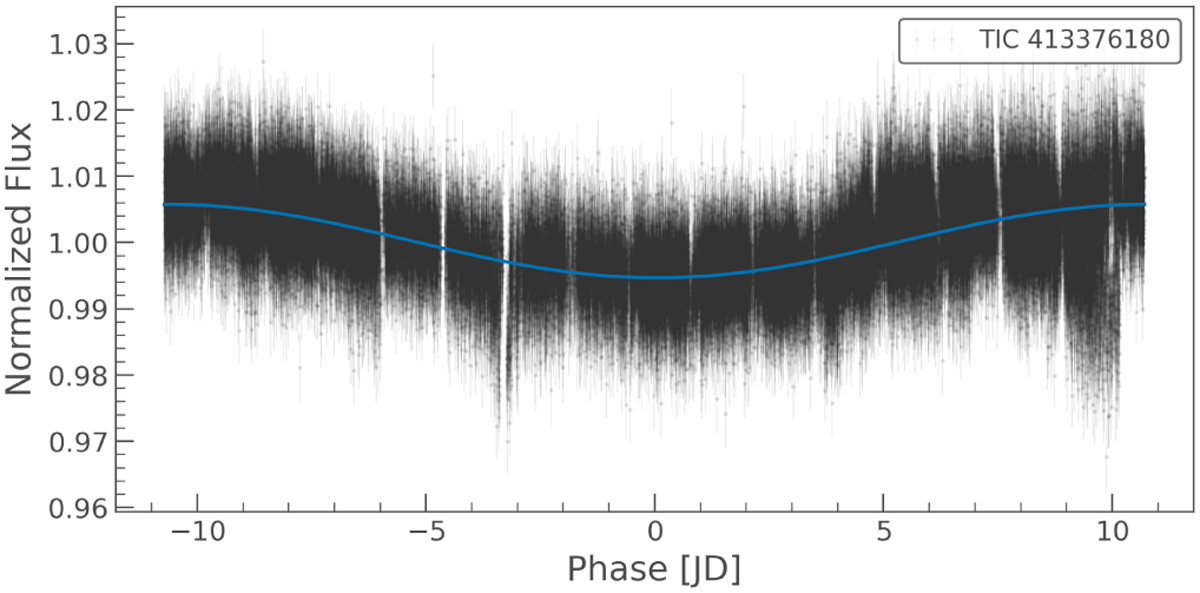
TESS total light curve (Sectors 10, 36, and 63) in phase with its combined GLS peak of 21.4 days (FAP<0.1% evaluated with the bootstrap method), from the simple aperture photometry (SAP) which was not corrected from long-term trends. The fit of the phased light curve is represented by a blue curve, while the transits of HATS-2 b have been removed.
Current usage metrics show cumulative count of Article Views (full-text article views including HTML views, PDF and ePub downloads, according to the available data) and Abstracts Views on Vision4Press platform.
Data correspond to usage on the plateform after 2015. The current usage metrics is available 48-96 hours after online publication and is updated daily on week days.
Initial download of the metrics may take a while.