Fig. A.1
Download original image
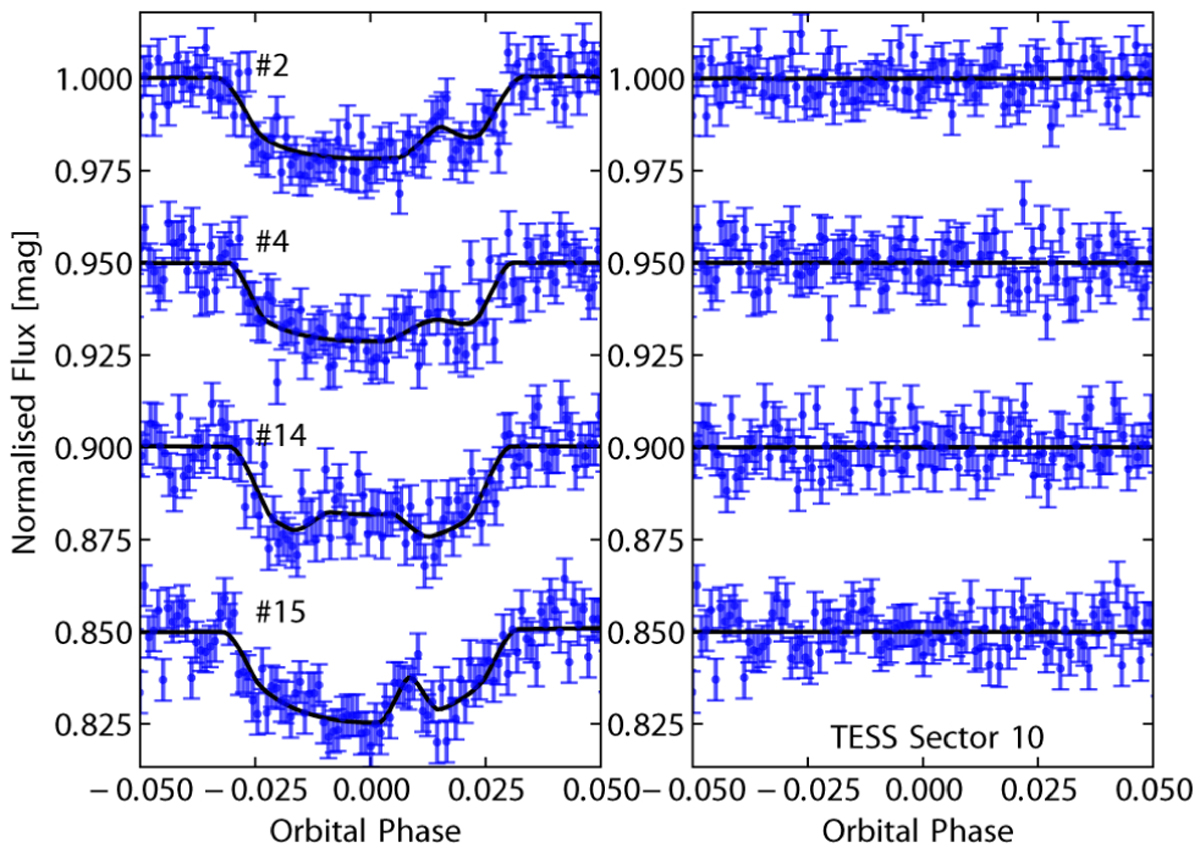
Left panel: Light curves of HATS-2 obtained from the Sector 10 of NASA’s TESS mission data and used in the analysis of the physical and starspot parameters of the system. They are plotted against the orbital phase and are compared to PRISM/GEMC best-fitting models. The labels indicate the observational ID (see Fig. 3). Right panel: Residuals of the fits represented with the same notation used in the left panel.
Current usage metrics show cumulative count of Article Views (full-text article views including HTML views, PDF and ePub downloads, according to the available data) and Abstracts Views on Vision4Press platform.
Data correspond to usage on the plateform after 2015. The current usage metrics is available 48-96 hours after online publication and is updated daily on week days.
Initial download of the metrics may take a while.