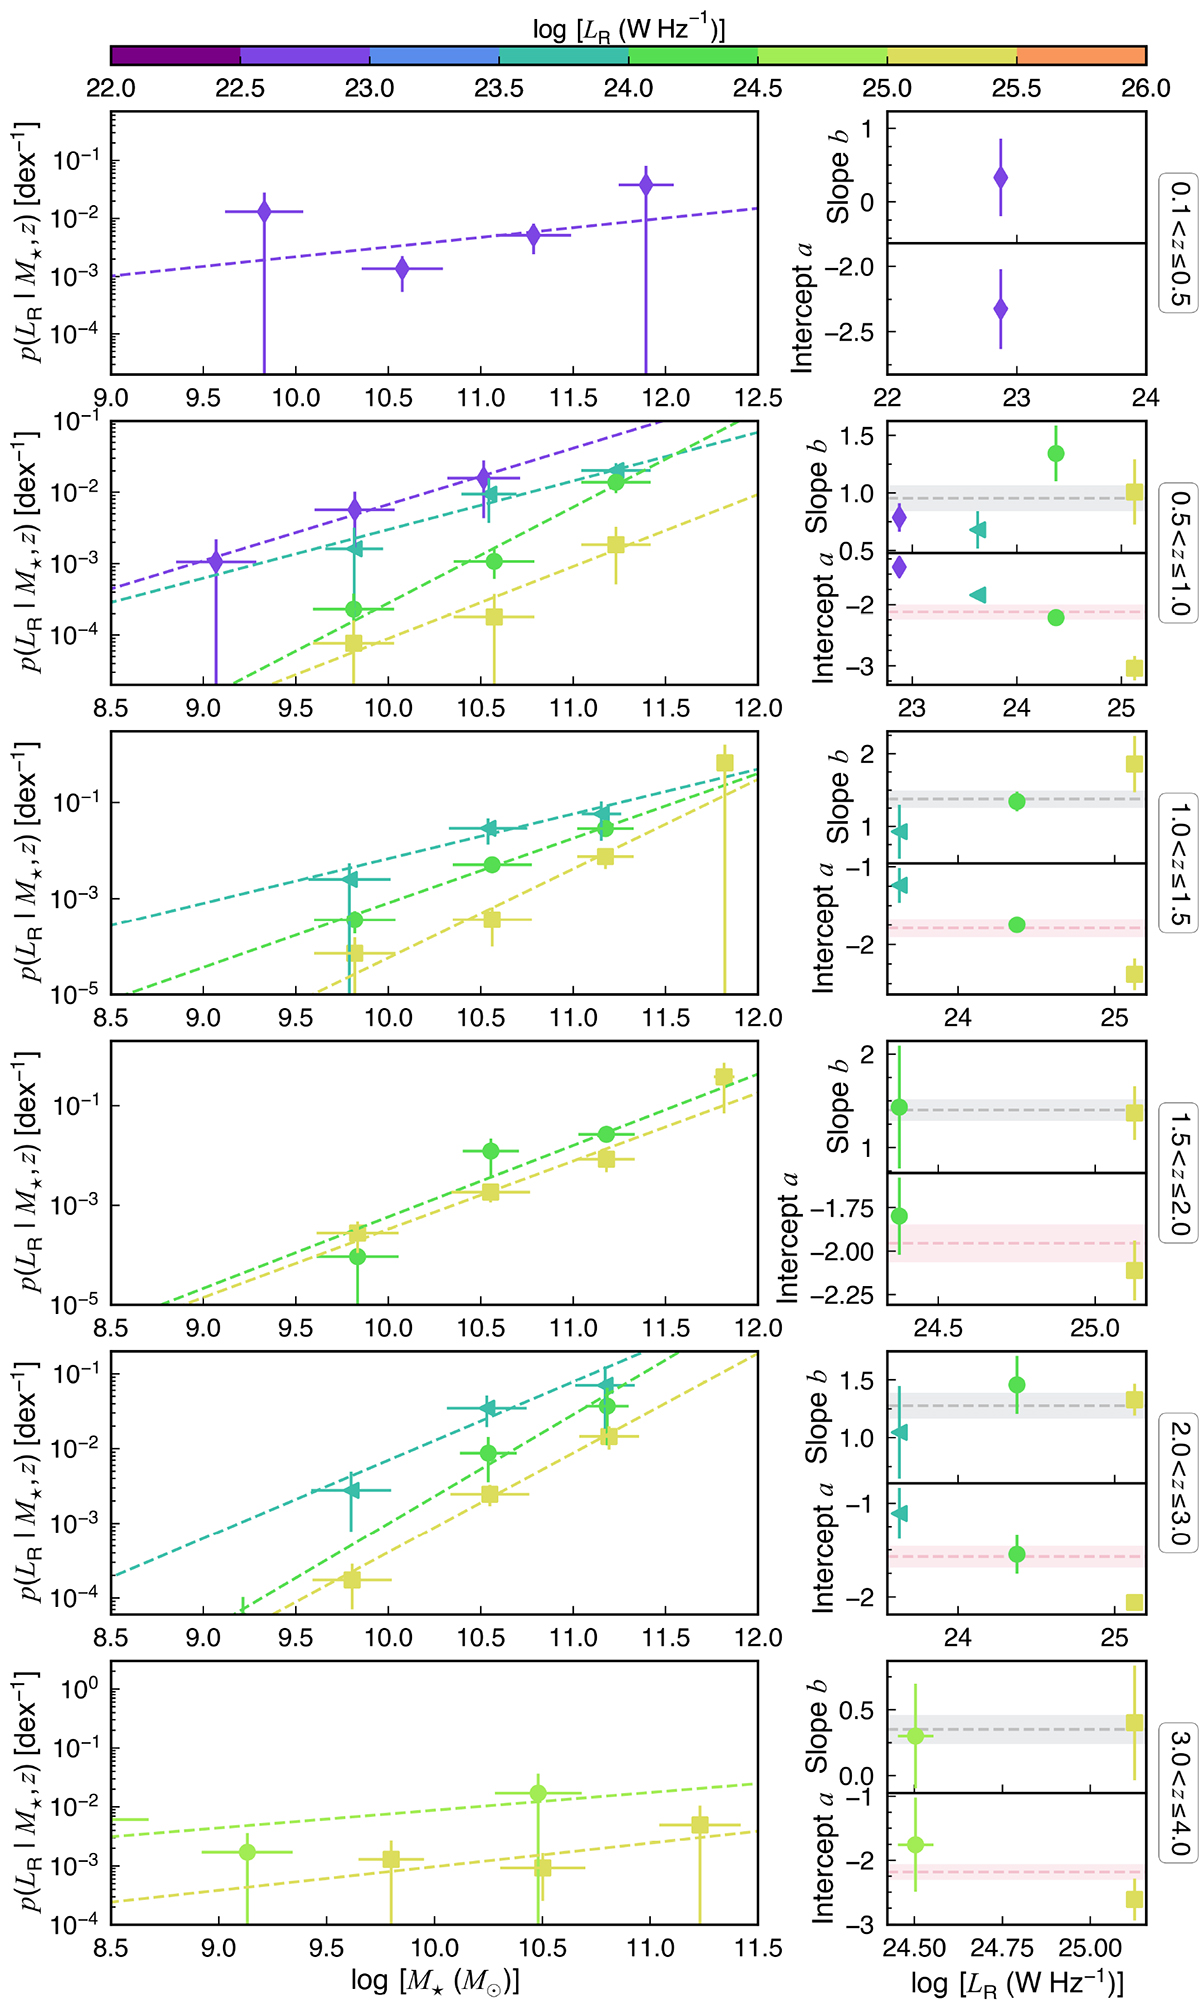
Fig. F.1.

Download original image
Probability density function p(LR | M⋆, z) of a SFG hosting a radio-excess AGN with a given 1.4 GHz luminosity LR as a function of stellar mass M⋆ (left column) and the corresponding best-fit parameters (right column). Left column: At each redshift bin (from top to bottom) the different colors represent different LR bins. Each dashed line represents the best-fit power-law relation for p(LR | M⋆, z) as a function of M⋆ in each LR bin (defined by Equation 22). Right column: Best-fit slope b (upper panel at each redshift bin) and intercept a (bottom panel at each redshift bin) of the above power-law relation. The different colors represent different LR bins (same as those in the left column). In the upper right panel of each redshift bin, the gray dashed line shows the mean of slopes over all the LR bins (![]() ), while the gray region represents
), while the gray region represents ![]() . In the bottom right panel of each redshift bin, the pink dashed line shows the mean of intercepts over all the LR bins (
. In the bottom right panel of each redshift bin, the pink dashed line shows the mean of intercepts over all the LR bins (![]() ), while the pink region represents
), while the pink region represents ![]() . The region scale (±0.1) is just a reference value to show the difference between each data point with the mean value.
. The region scale (±0.1) is just a reference value to show the difference between each data point with the mean value.
Current usage metrics show cumulative count of Article Views (full-text article views including HTML views, PDF and ePub downloads, according to the available data) and Abstracts Views on Vision4Press platform.
Data correspond to usage on the plateform after 2015. The current usage metrics is available 48-96 hours after online publication and is updated daily on week days.
Initial download of the metrics may take a while.


