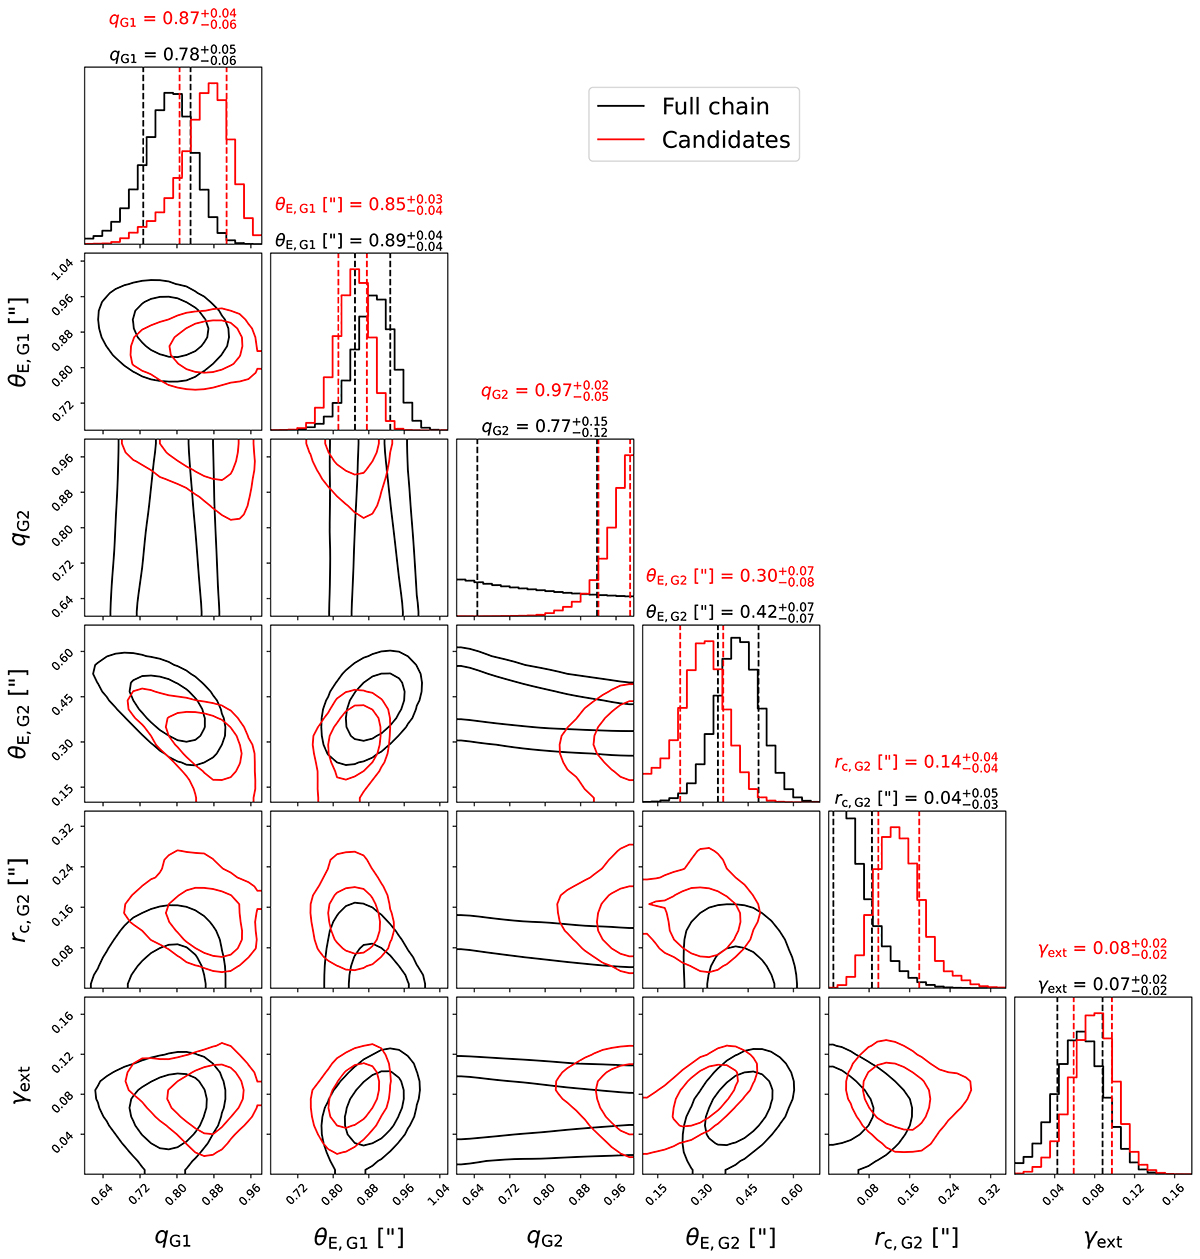
Fig. B.1.
Download original image
PL1 + cPL2 + γext: posterior distributions for several lens-mass parameters of the power-law profile (see Sect. 4) and the external shear strength. We show the distributions for candidate models (i.e., models that predict four observable quasar images) in red, and the distribution of the whole MCMC chain is plotted in black. The two contours show the 1σ and 2σ credible regions. The one-dimensional histograms show the marginalized posterior distribution for the selected mass parameters, and the vertical lines mark the 1σ confidence intervals.
Current usage metrics show cumulative count of Article Views (full-text article views including HTML views, PDF and ePub downloads, according to the available data) and Abstracts Views on Vision4Press platform.
Data correspond to usage on the plateform after 2015. The current usage metrics is available 48-96 hours after online publication and is updated daily on week days.
Initial download of the metrics may take a while.