Fig. 5.
Download original image
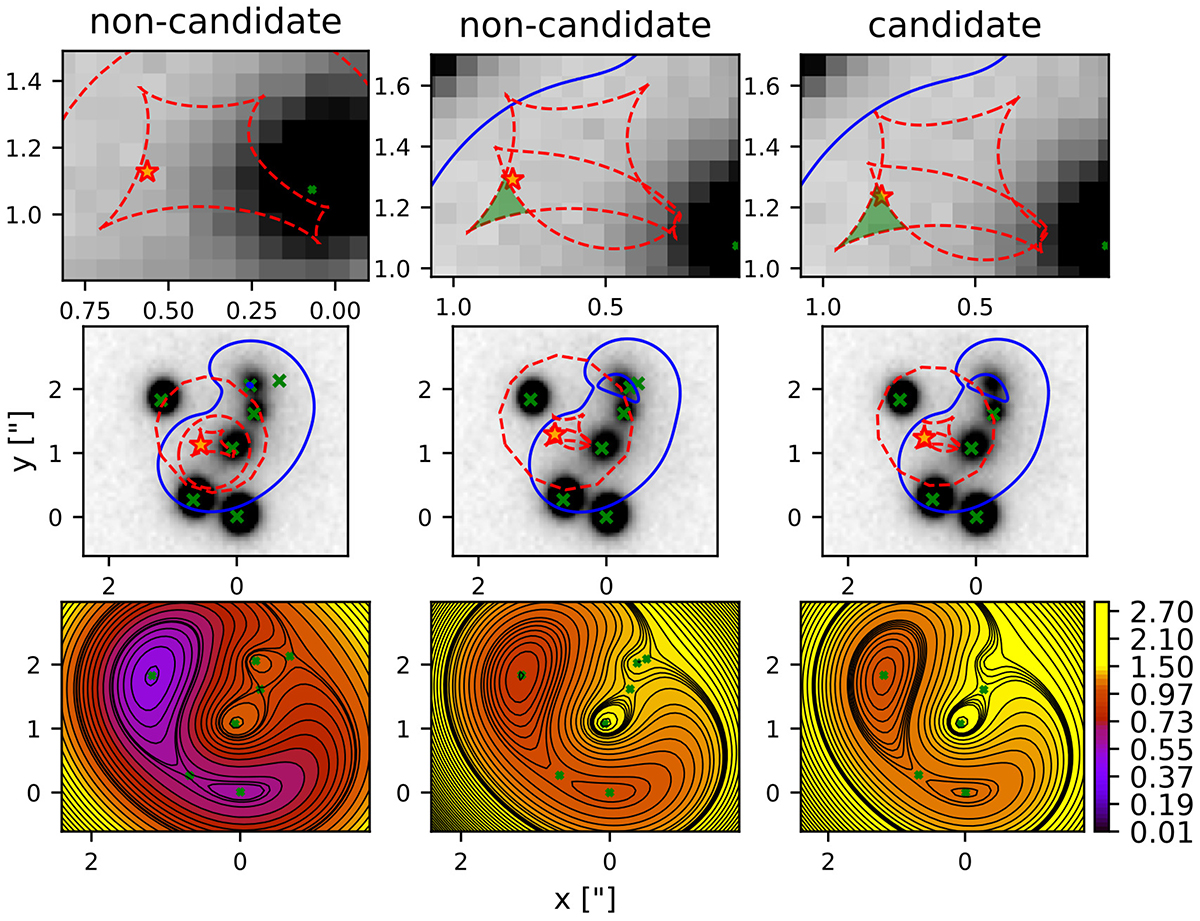
Change of critical curves and caustics between noncandidate models (left and middle columns) and one candidate model (right column). The top and middle rows show the critical curves (blue, solid lines) and caustic curves (red, dashed lines). The bottom row shows the Fermat potential and contours with the color scale in units of arcsec2. As the core radius of G2 increases and the source position crosses the radial caustic into the shaded green region, the time-delay saddle point associated with image E merges with the maximum of G2 and image E disappears. The source position is plotted as a yellow star. The predicted image positions are shown as green crosses in each panel.
Current usage metrics show cumulative count of Article Views (full-text article views including HTML views, PDF and ePub downloads, according to the available data) and Abstracts Views on Vision4Press platform.
Data correspond to usage on the plateform after 2015. The current usage metrics is available 48-96 hours after online publication and is updated daily on week days.
Initial download of the metrics may take a while.