Open Access
Fig. 2.
Download original image
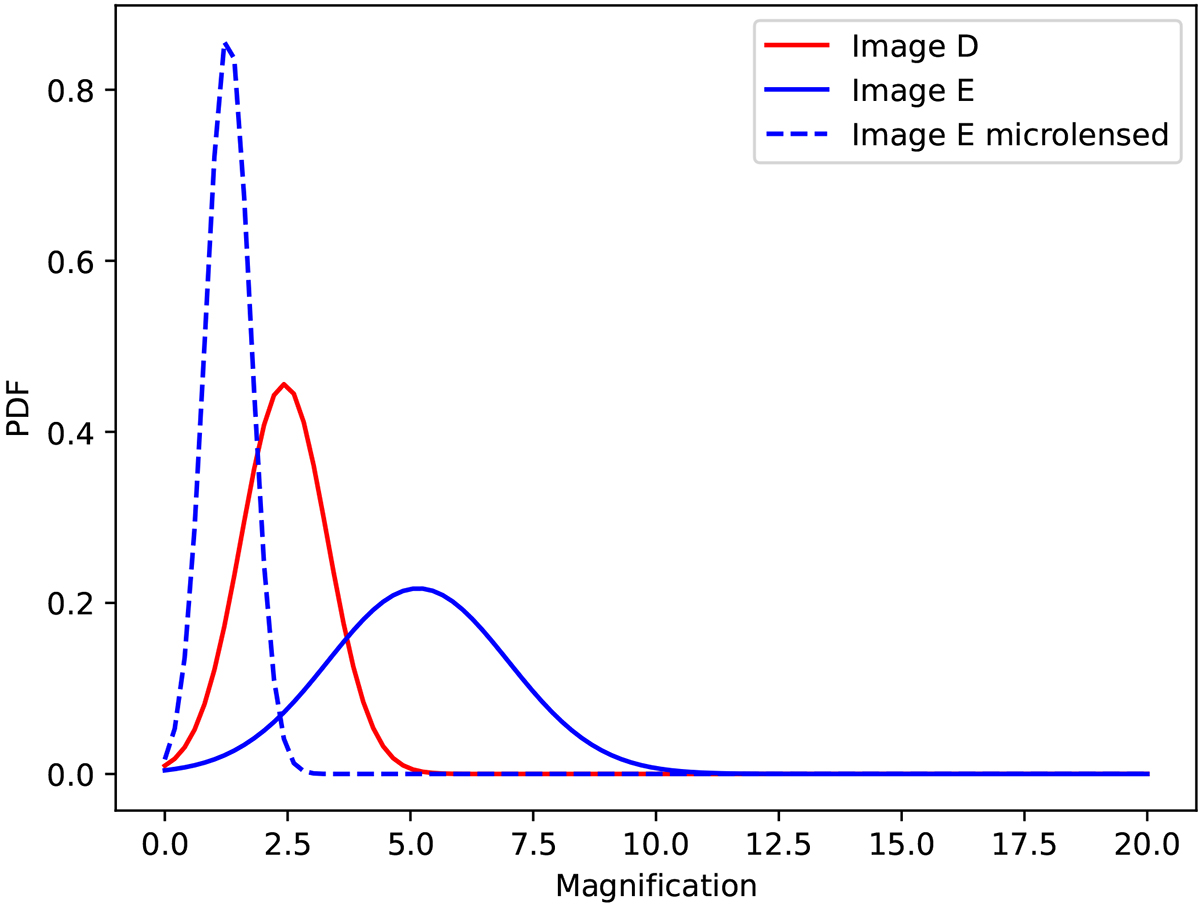
Distributions of predicted image magnifications for the observed image D (red, solid line), the model-predicted image E (blue, solid line), and the demagnified image E in a worst-case microlensing scenario (blue, dashed line). Even if image E were strongly demagnified by microlensing, it would still be observable.
Current usage metrics show cumulative count of Article Views (full-text article views including HTML views, PDF and ePub downloads, according to the available data) and Abstracts Views on Vision4Press platform.
Data correspond to usage on the plateform after 2015. The current usage metrics is available 48-96 hours after online publication and is updated daily on week days.
Initial download of the metrics may take a while.