Fig. 7
Download original image
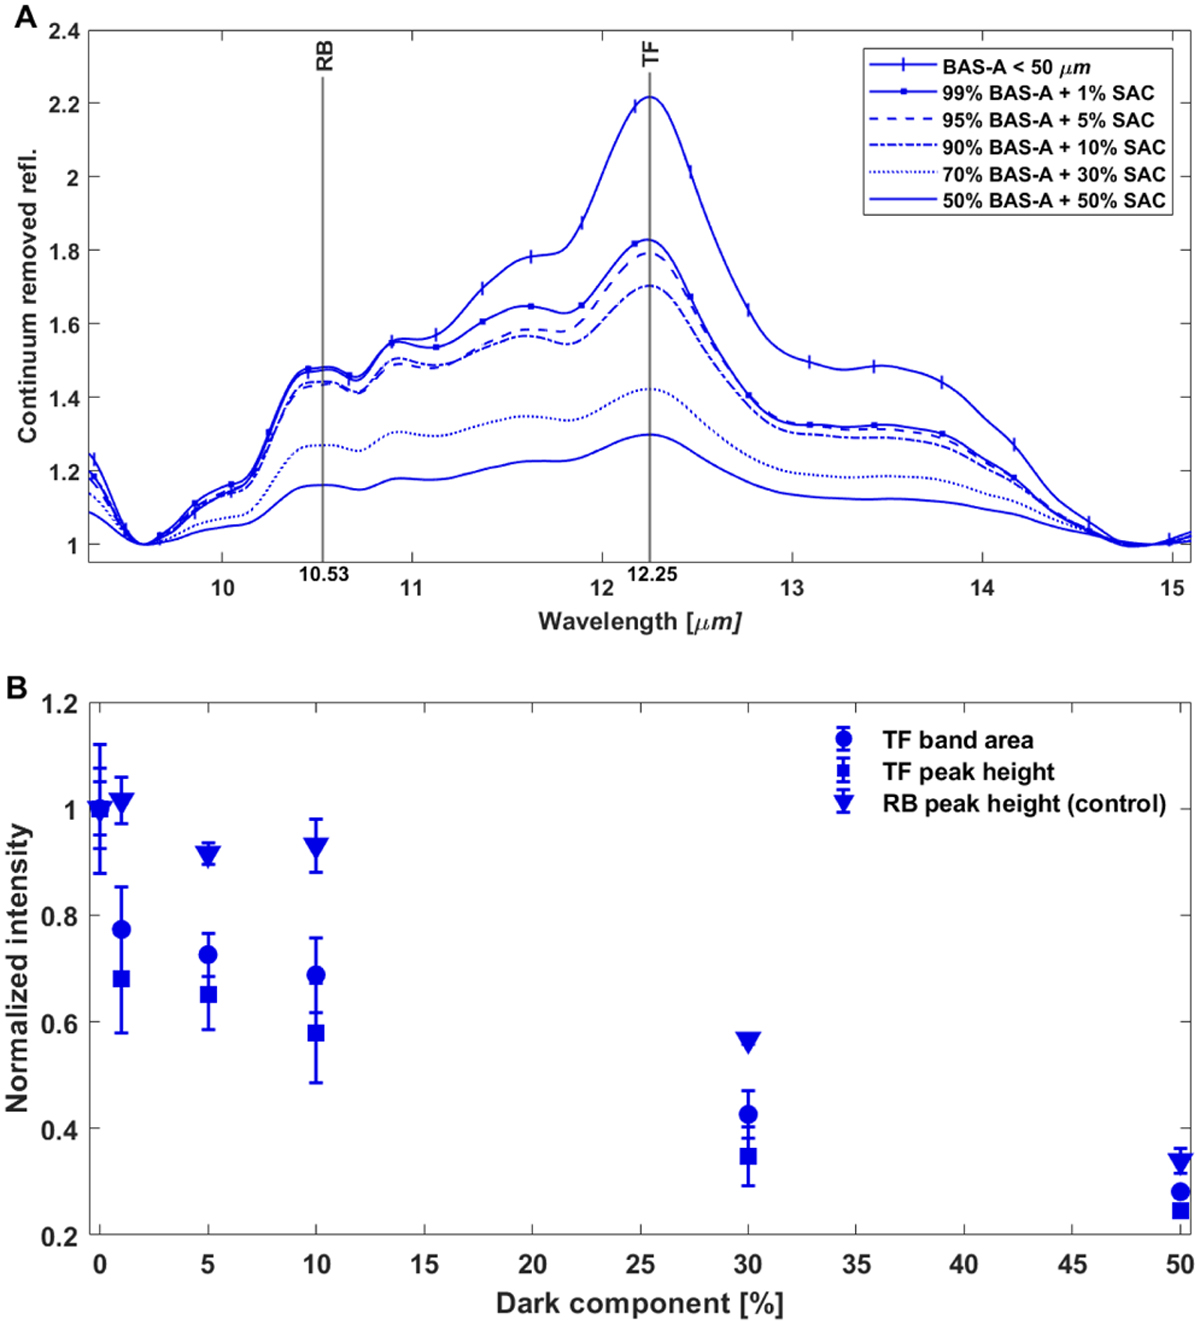
Continuum-removed IR spectra of BAS-A sample mixed in different proportions (from 1 to 50%) with synthetic amorphous carbon [SAC], spectra are limited in the range 7.5–15 µm to highlight the TF band region, shown in panel A. Panel B: TF band area along with TF and RB peak height, normalized at the value of pure BAS-A samples, evaluated for each percentage of SAC added to the mixtures.
Current usage metrics show cumulative count of Article Views (full-text article views including HTML views, PDF and ePub downloads, according to the available data) and Abstracts Views on Vision4Press platform.
Data correspond to usage on the plateform after 2015. The current usage metrics is available 48-96 hours after online publication and is updated daily on week days.
Initial download of the metrics may take a while.