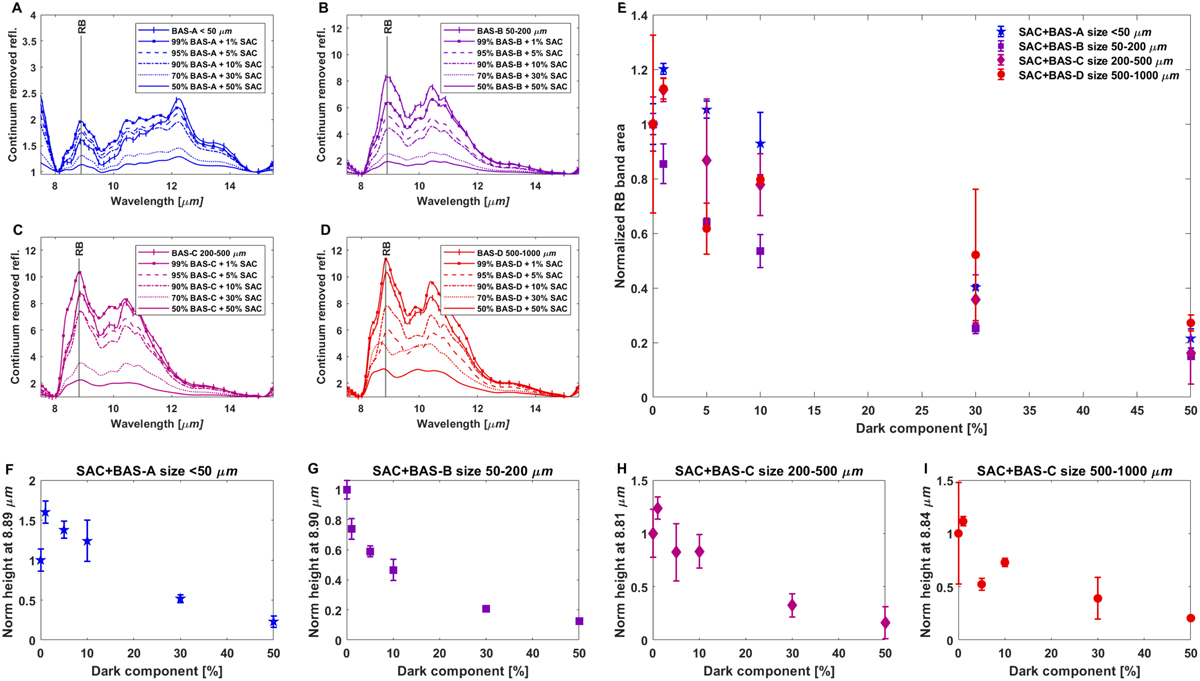
Fig. 6
Download original image
Continuum-removed infrared spectra of basaltic samples (BAS) at different grain sizes (<50, 50–200, 200–500 and 500–1000 µm) mixed in different proportions (from 1 to 50%) with synthetic amorphous carbon [SAC], spectra are limited in the range 7.5–15.5 µm to highlight the RB region, shown in panels A, B, C, and D. Panel E: band area, normalized at the value of pure BAS samples, evaluated for each series of mixing. Panels F, G, H and I: height of the peak of RBs normalized at the value of pure BAS and evaluated for each series of mixtures (see Table A.1 for the precise wavelength and method used for peak depth evaluation).
Current usage metrics show cumulative count of Article Views (full-text article views including HTML views, PDF and ePub downloads, according to the available data) and Abstracts Views on Vision4Press platform.
Data correspond to usage on the plateform after 2015. The current usage metrics is available 48-96 hours after online publication and is updated daily on week days.
Initial download of the metrics may take a while.