Fig. 5
Download original image
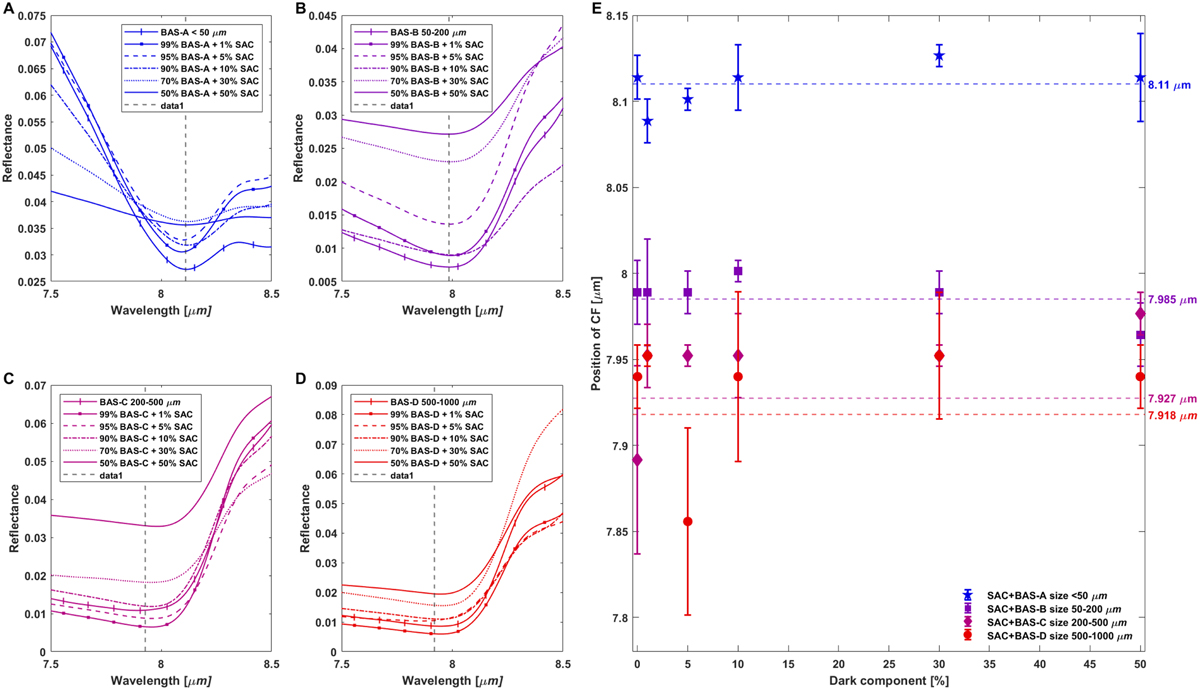
IR spectra of basaltic samples [BAS] at different grain sizes (<50, 50–200, 200–500, and 500–1000 µm) mixed in different proportions (from 1 to 50%) with synthetic amorphous carbon [SAC], spectra are limited in the range of 7.5–9.5 µm to highlight the CF position, shown in panels A, B, C, and D. The average value for each grain size is represented by the vertical dashed black line. Panel E: Position of each mixture with different percentage of dark material. Dashed horizontal lines and the label on the right show the average value of the CF position for each BAS sample series.
Current usage metrics show cumulative count of Article Views (full-text article views including HTML views, PDF and ePub downloads, according to the available data) and Abstracts Views on Vision4Press platform.
Data correspond to usage on the plateform after 2015. The current usage metrics is available 48-96 hours after online publication and is updated daily on week days.
Initial download of the metrics may take a while.