Fig. 3
Download original image
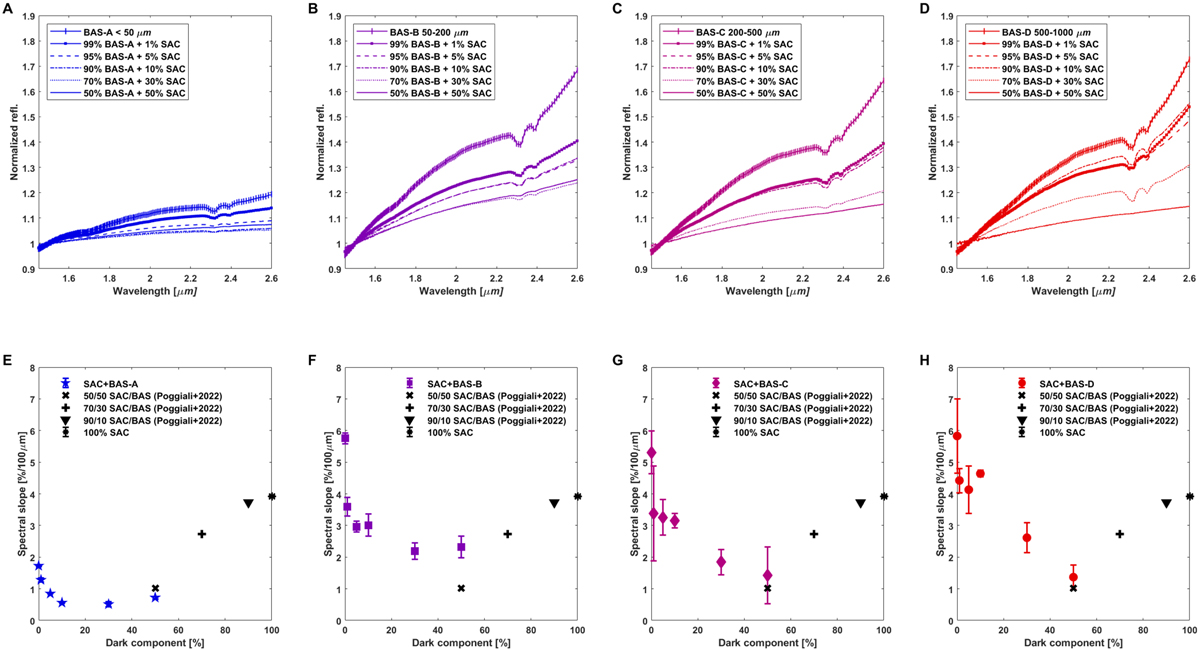
Slope evaluation for the mixtures studied in this work. Panels A, B, C, and D: IR spectra normalized at 1.5 µm of basaltic samples [BAS] at different grain sizes (<50, 50–200, 200–500 and 500–1000 µm) mixed in different proportions (from 1 to 50%) with synthetic amorphous carbon [SAC], spectra are limited in the range 1.4–2.6 µm. Panels E, F, G, and H: values of the slope against percentage of SAC dark component for each mixture with errors. The black cross, plus, and triangle markers are the value of the slope for mixture at 50%, 70%, and 90%, respectively, from Poggiali et al. (2022). The black star marker is the value of the slope of pure SAC. Note: the samples at 50%, 70%, and 90% have a grain size that is comparable to that of sample SAC-A (<50 µm).
Current usage metrics show cumulative count of Article Views (full-text article views including HTML views, PDF and ePub downloads, according to the available data) and Abstracts Views on Vision4Press platform.
Data correspond to usage on the plateform after 2015. The current usage metrics is available 48-96 hours after online publication and is updated daily on week days.
Initial download of the metrics may take a while.