Fig. 2
Download original image
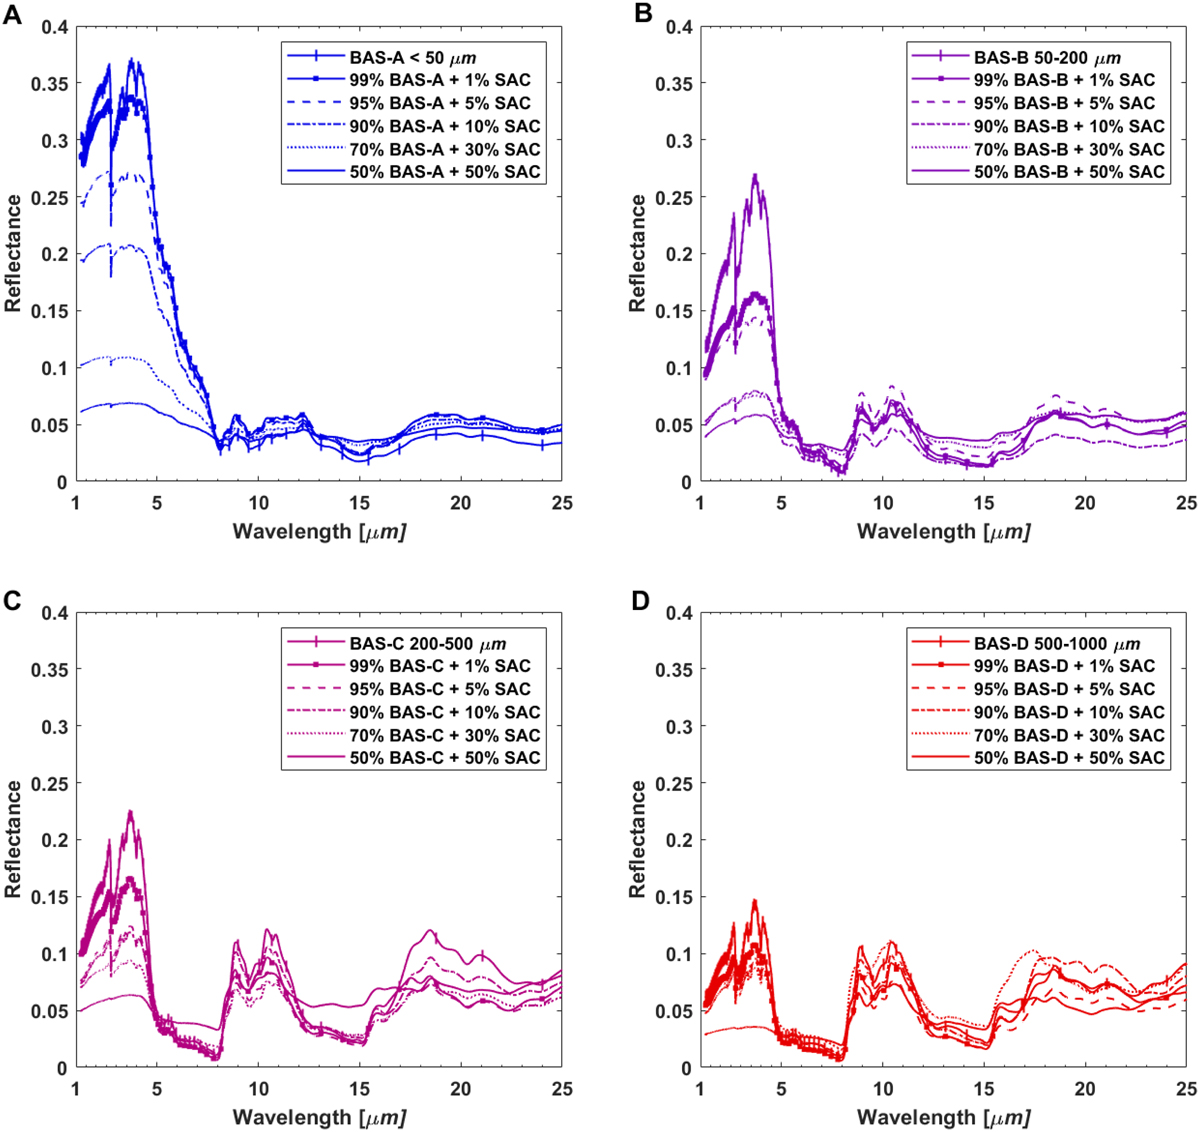
IR spectra of basaltic mixtures [BAS] at different grain sizes in different proportions with synthetic amorphous carbon [SAC]. Top left panel: <50 µm; top-right panel: 50–200 µm; bottom-left panel: 200–500 µm; and bottom-right panel: 500–1000 µm. The mixture with different proportion of SAC are represented in each panel with continuous line with dash marker (0%), continuous line with a dot marker (1%), dashed line (5%), dashed-dotted line (10%), dotted line (30%), and pure continuous line (50%). The intensity scale is the same for each panel to enhance the difference in reflectance level among the four mixture combinations.
Current usage metrics show cumulative count of Article Views (full-text article views including HTML views, PDF and ePub downloads, according to the available data) and Abstracts Views on Vision4Press platform.
Data correspond to usage on the plateform after 2015. The current usage metrics is available 48-96 hours after online publication and is updated daily on week days.
Initial download of the metrics may take a while.