Fig. A.2
Download original image
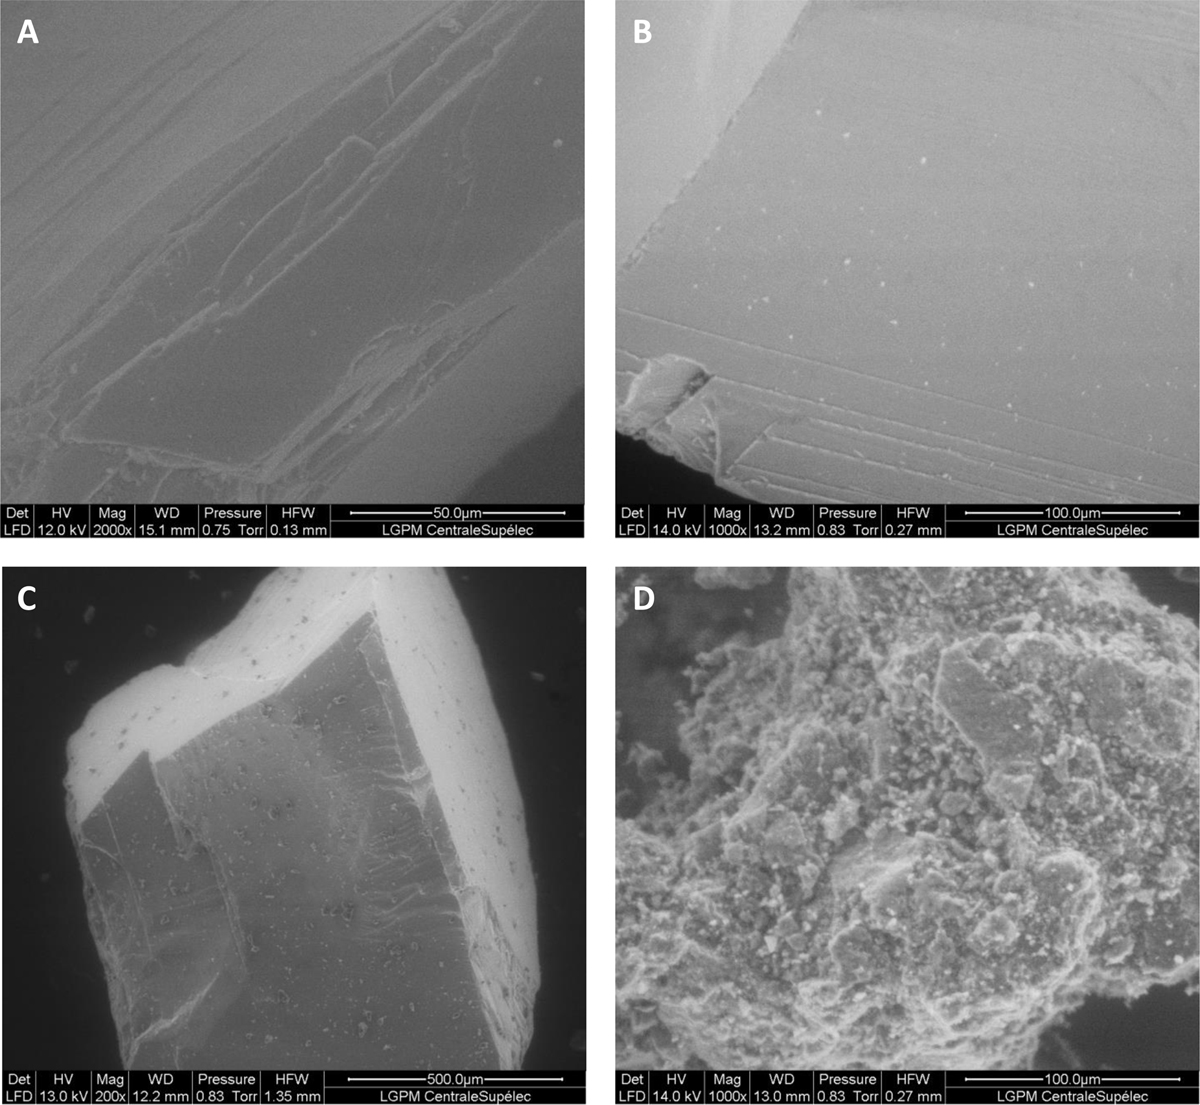
SEM images of some of the mixed sample prepared in this work. Panels A to D: Samples MIX-01C, MIX-02C, MIX-03D, and MIX-05B, respectively. The nominal percentage of SAC distributed on the bright grain surface increase is, respectively, 1%, 5%, 10%, and 50% among different samples. Spatial scale is not the same for all the images to shows the samples at different zoom levels.
Current usage metrics show cumulative count of Article Views (full-text article views including HTML views, PDF and ePub downloads, according to the available data) and Abstracts Views on Vision4Press platform.
Data correspond to usage on the plateform after 2015. The current usage metrics is available 48-96 hours after online publication and is updated daily on week days.
Initial download of the metrics may take a while.