Fig. 8.

Download original image
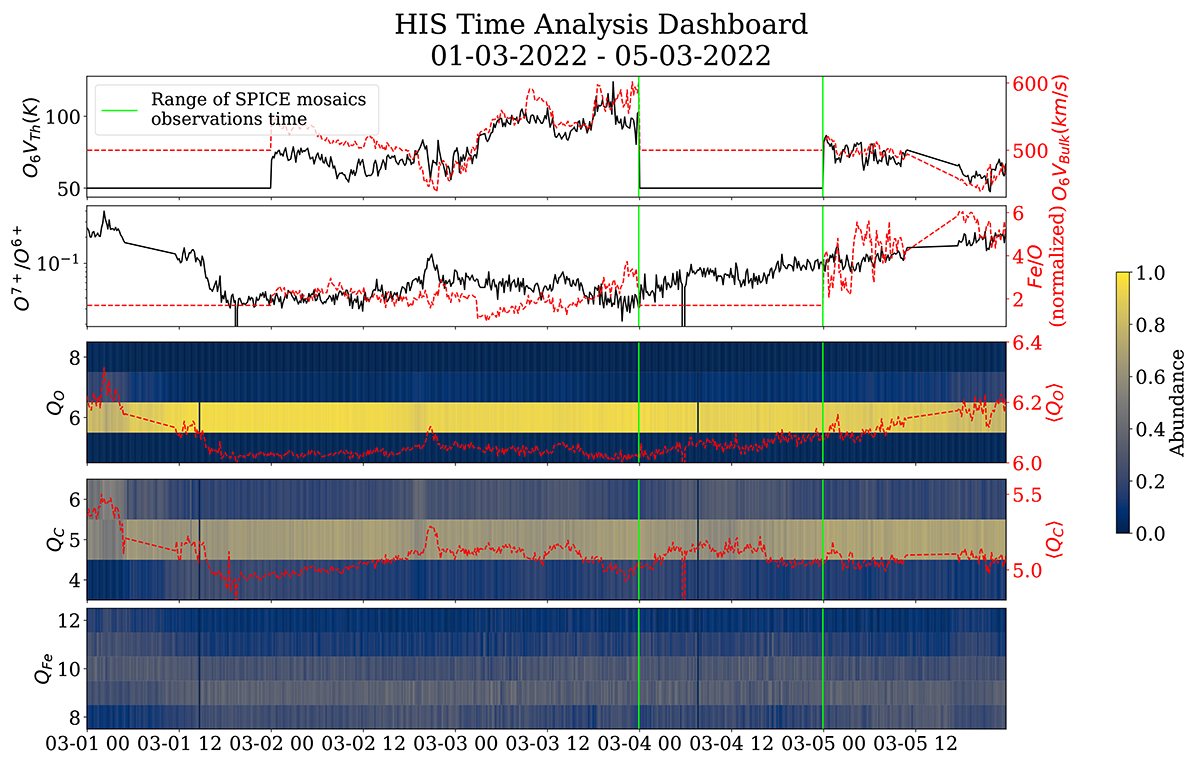
Multi-panel plot from HIS data recorded from March 1st 00:00 UTC to March 6th 00:00 UTC. Top panel: O6+ thermal and bulk velocity, second panel: O7+/O6+ ratio and elemental Fe/O ratio (which has been normalized by the photospheric value 0.059 Asplund et al. 2021 for easy comparison with FIP bias values). The three bottom panels show the charge state distribution of elements O, C and Fe, as well as their average for O and C (⟨QO⟩,⟨QC⟩).
Current usage metrics show cumulative count of Article Views (full-text article views including HTML views, PDF and ePub downloads, according to the available data) and Abstracts Views on Vision4Press platform.
Data correspond to usage on the plateform after 2015. The current usage metrics is available 48-96 hours after online publication and is updated daily on week days.
Initial download of the metrics may take a while.


