Fig. 7.
Download original image
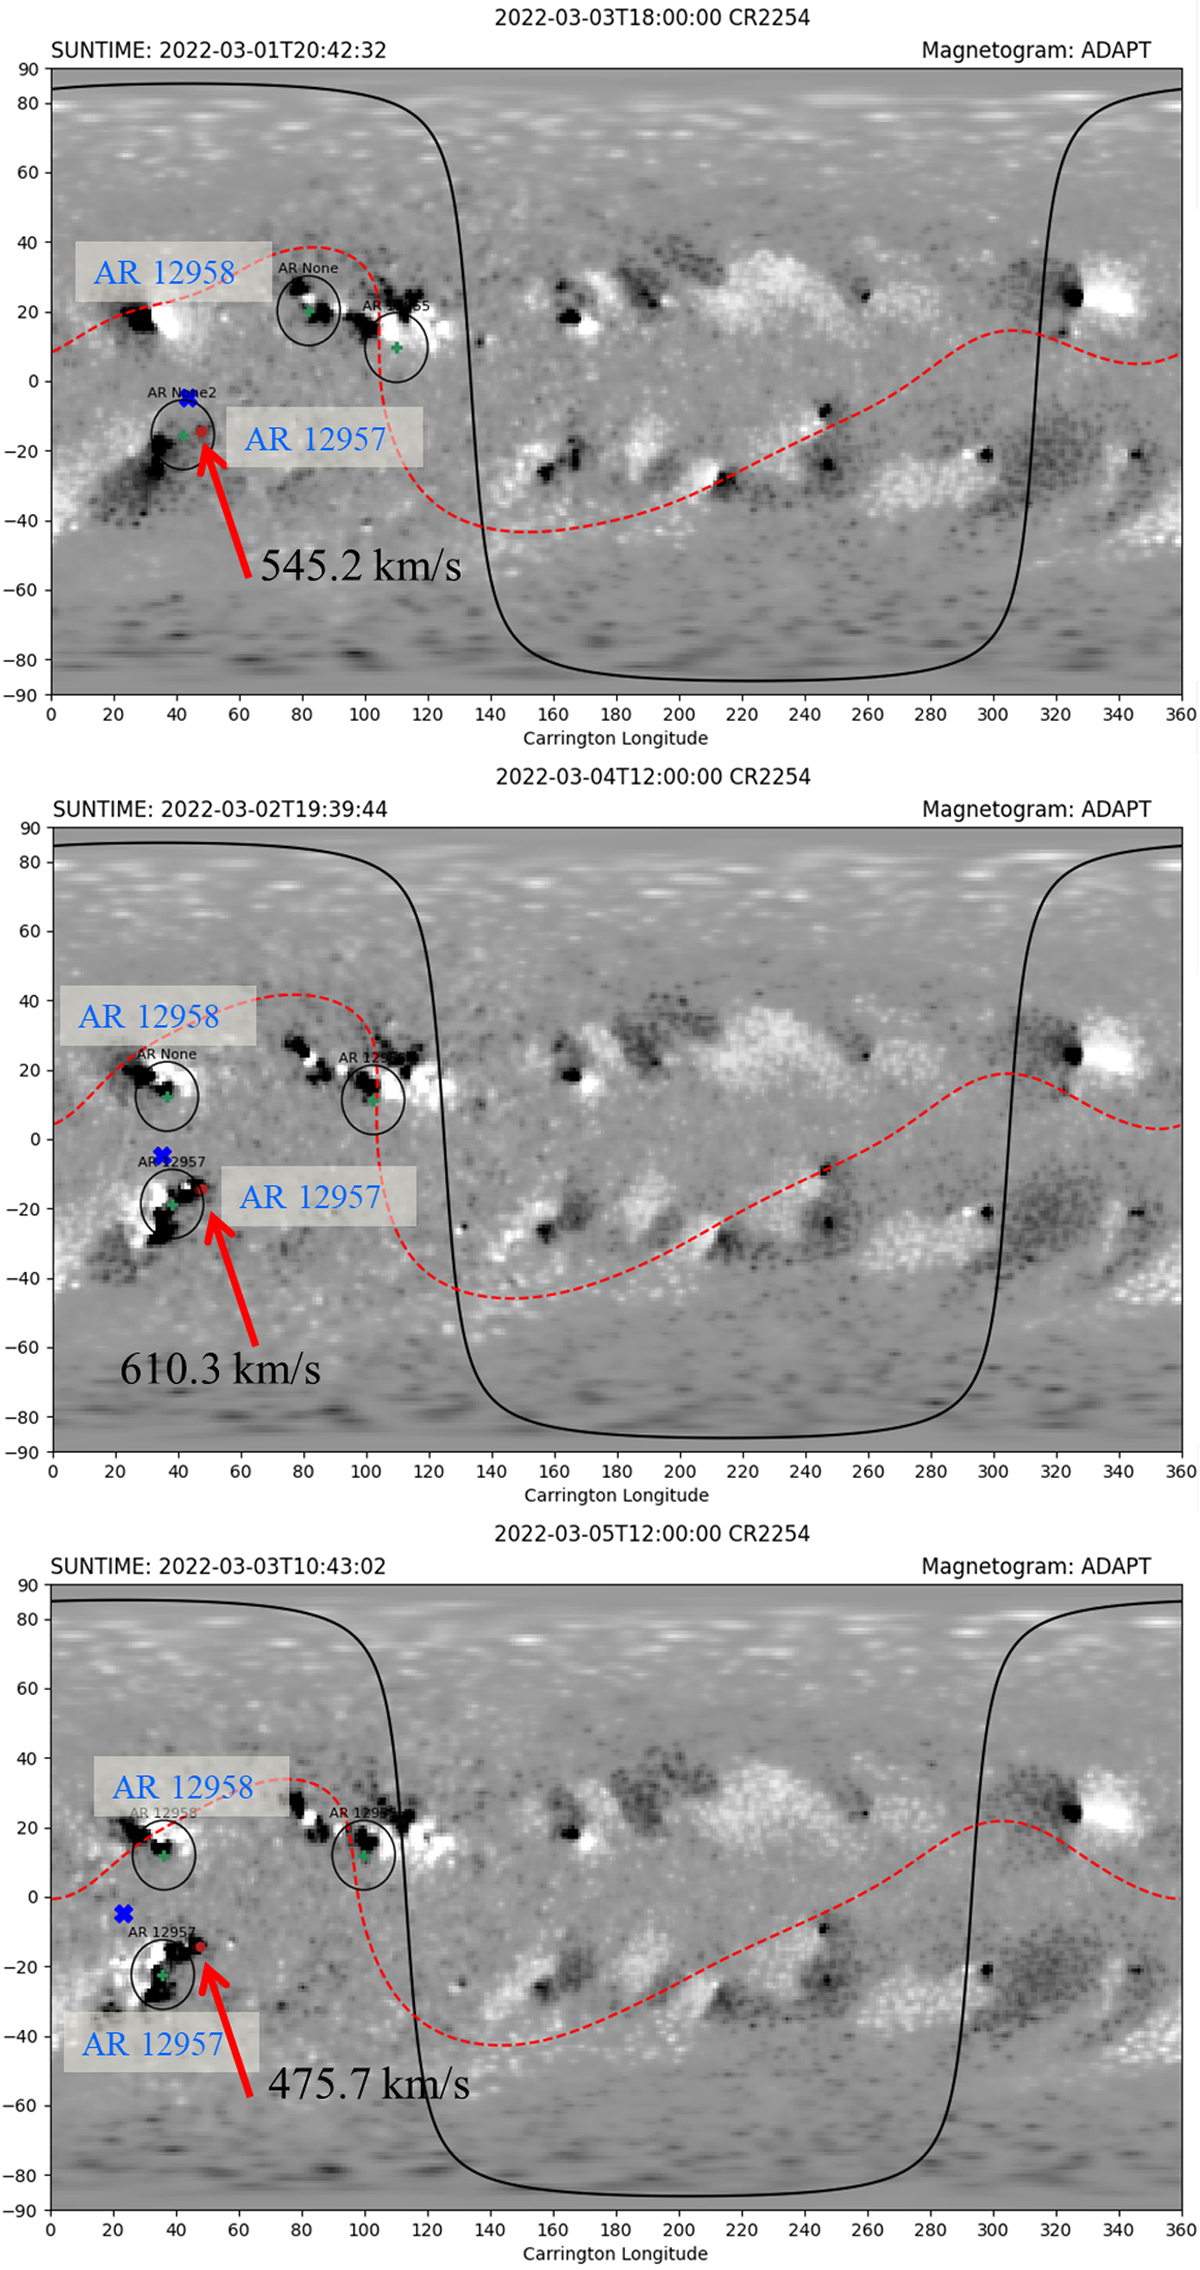
Connectivity maps from the MADAWG connectivity tool, from March 1, 2022 to March 3, 2022. The maps are plotted over ADAPT magnetograms. The blue cross represents the sub-spacecraft point, and the red dot (pointed at by the red arrow) the footpoint of the measured solar wind. The red dashed line represents the Heliospheric current sheet, and the solid black curve the visible disk from SolO.
Current usage metrics show cumulative count of Article Views (full-text article views including HTML views, PDF and ePub downloads, according to the available data) and Abstracts Views on Vision4Press platform.
Data correspond to usage on the plateform after 2015. The current usage metrics is available 48-96 hours after online publication and is updated daily on week days.
Initial download of the metrics may take a while.