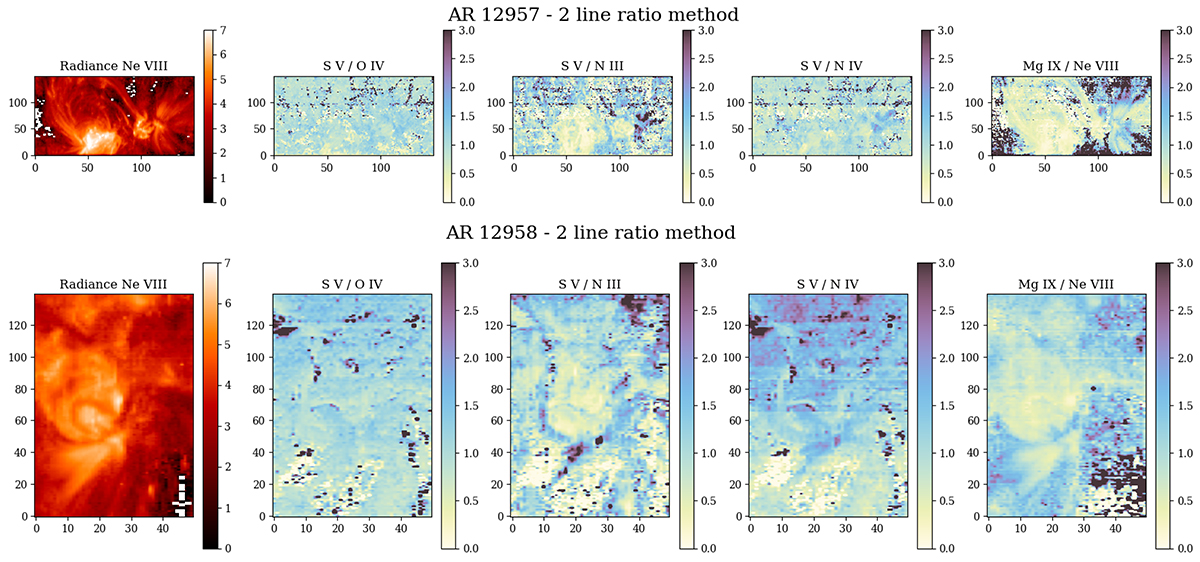
Fig. 11.
Download original image
FIP bias diagnostic using the 2LR method. The top panel represents the AR observed in panel B of the mosaic, while the bottom panel is a zoom over the AR observed in panel A of the mosaic. White pixels are areas where the signal was too low to draw any conclusions about the diagnostic result. Darker areas suggest higher FIP-bias values, and therefore coronal-like abundances and potential sources of slow solar wind.
Current usage metrics show cumulative count of Article Views (full-text article views including HTML views, PDF and ePub downloads, according to the available data) and Abstracts Views on Vision4Press platform.
Data correspond to usage on the plateform after 2015. The current usage metrics is available 48-96 hours after online publication and is updated daily on week days.
Initial download of the metrics may take a while.