Fig. G.1
Download original image
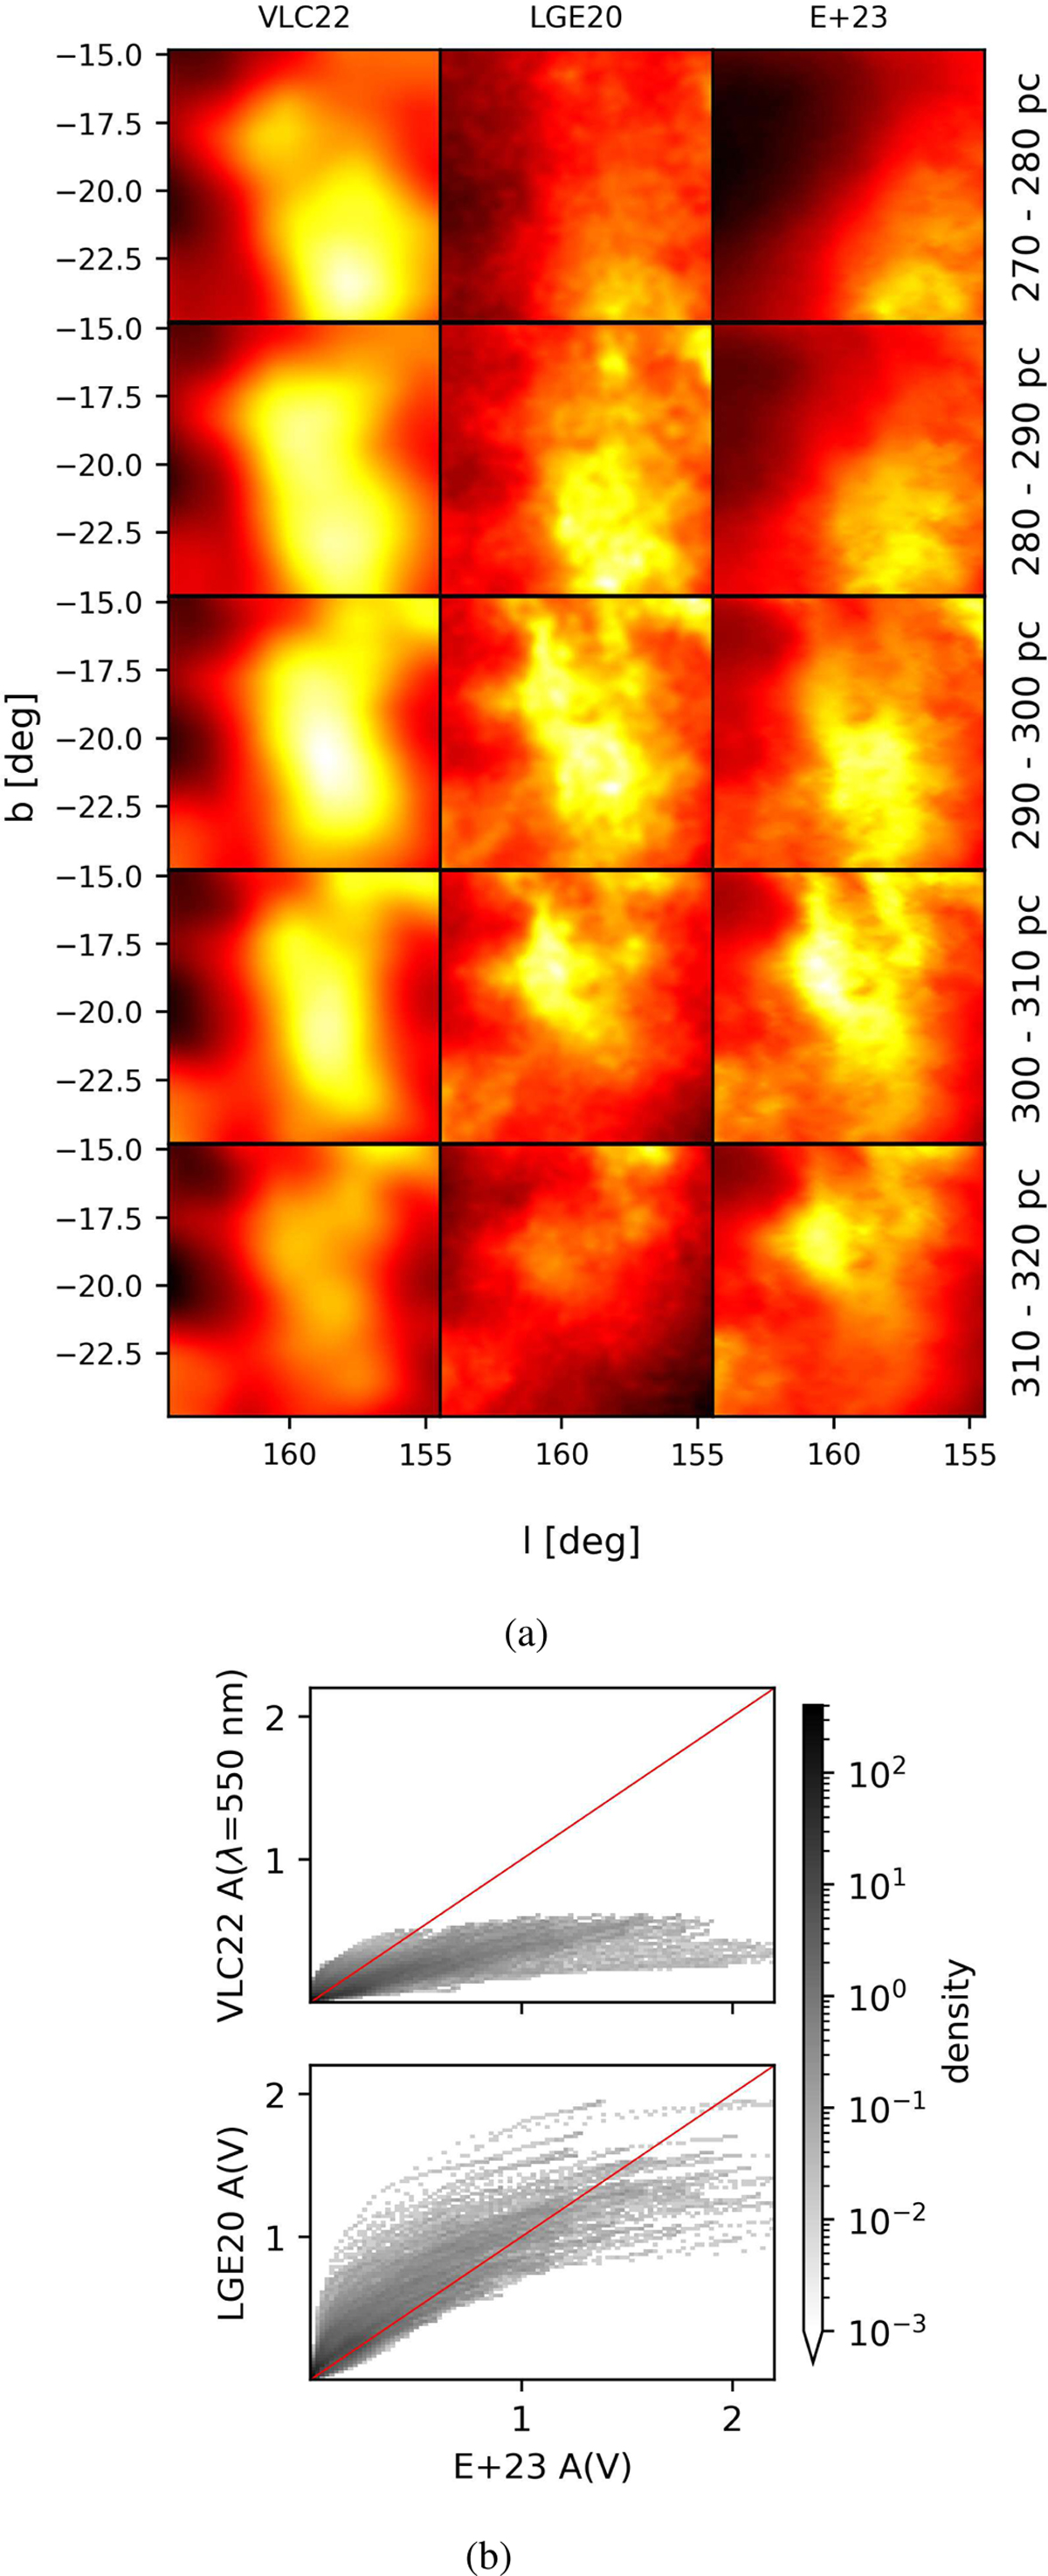
Comparison of different dust maps for Perseus. Panel (a): Zoomed-in view of Figure 11 toward Perseus akin to Figure 12, in different distant slices. Columns depict dust reconstructions, while rows depict distance slices. The logarithmic colorbars are separate for the reconstructions but shared for different distance slices. Panel (b): Comparison of the mean posterior extinction integrated from the lowest distance of Panel (a) to regularly spaced points in the distance range of Panel (a). The extinction predictions for our map versus LGE20 and VLC22 are shown as histograms. The binning is linear and the colorbar logarithmic. The bisectors are shown in red.
Current usage metrics show cumulative count of Article Views (full-text article views including HTML views, PDF and ePub downloads, according to the available data) and Abstracts Views on Vision4Press platform.
Data correspond to usage on the plateform after 2015. The current usage metrics is available 48-96 hours after online publication and is updated daily on week days.
Initial download of the metrics may take a while.