Fig. D.1
Download original image
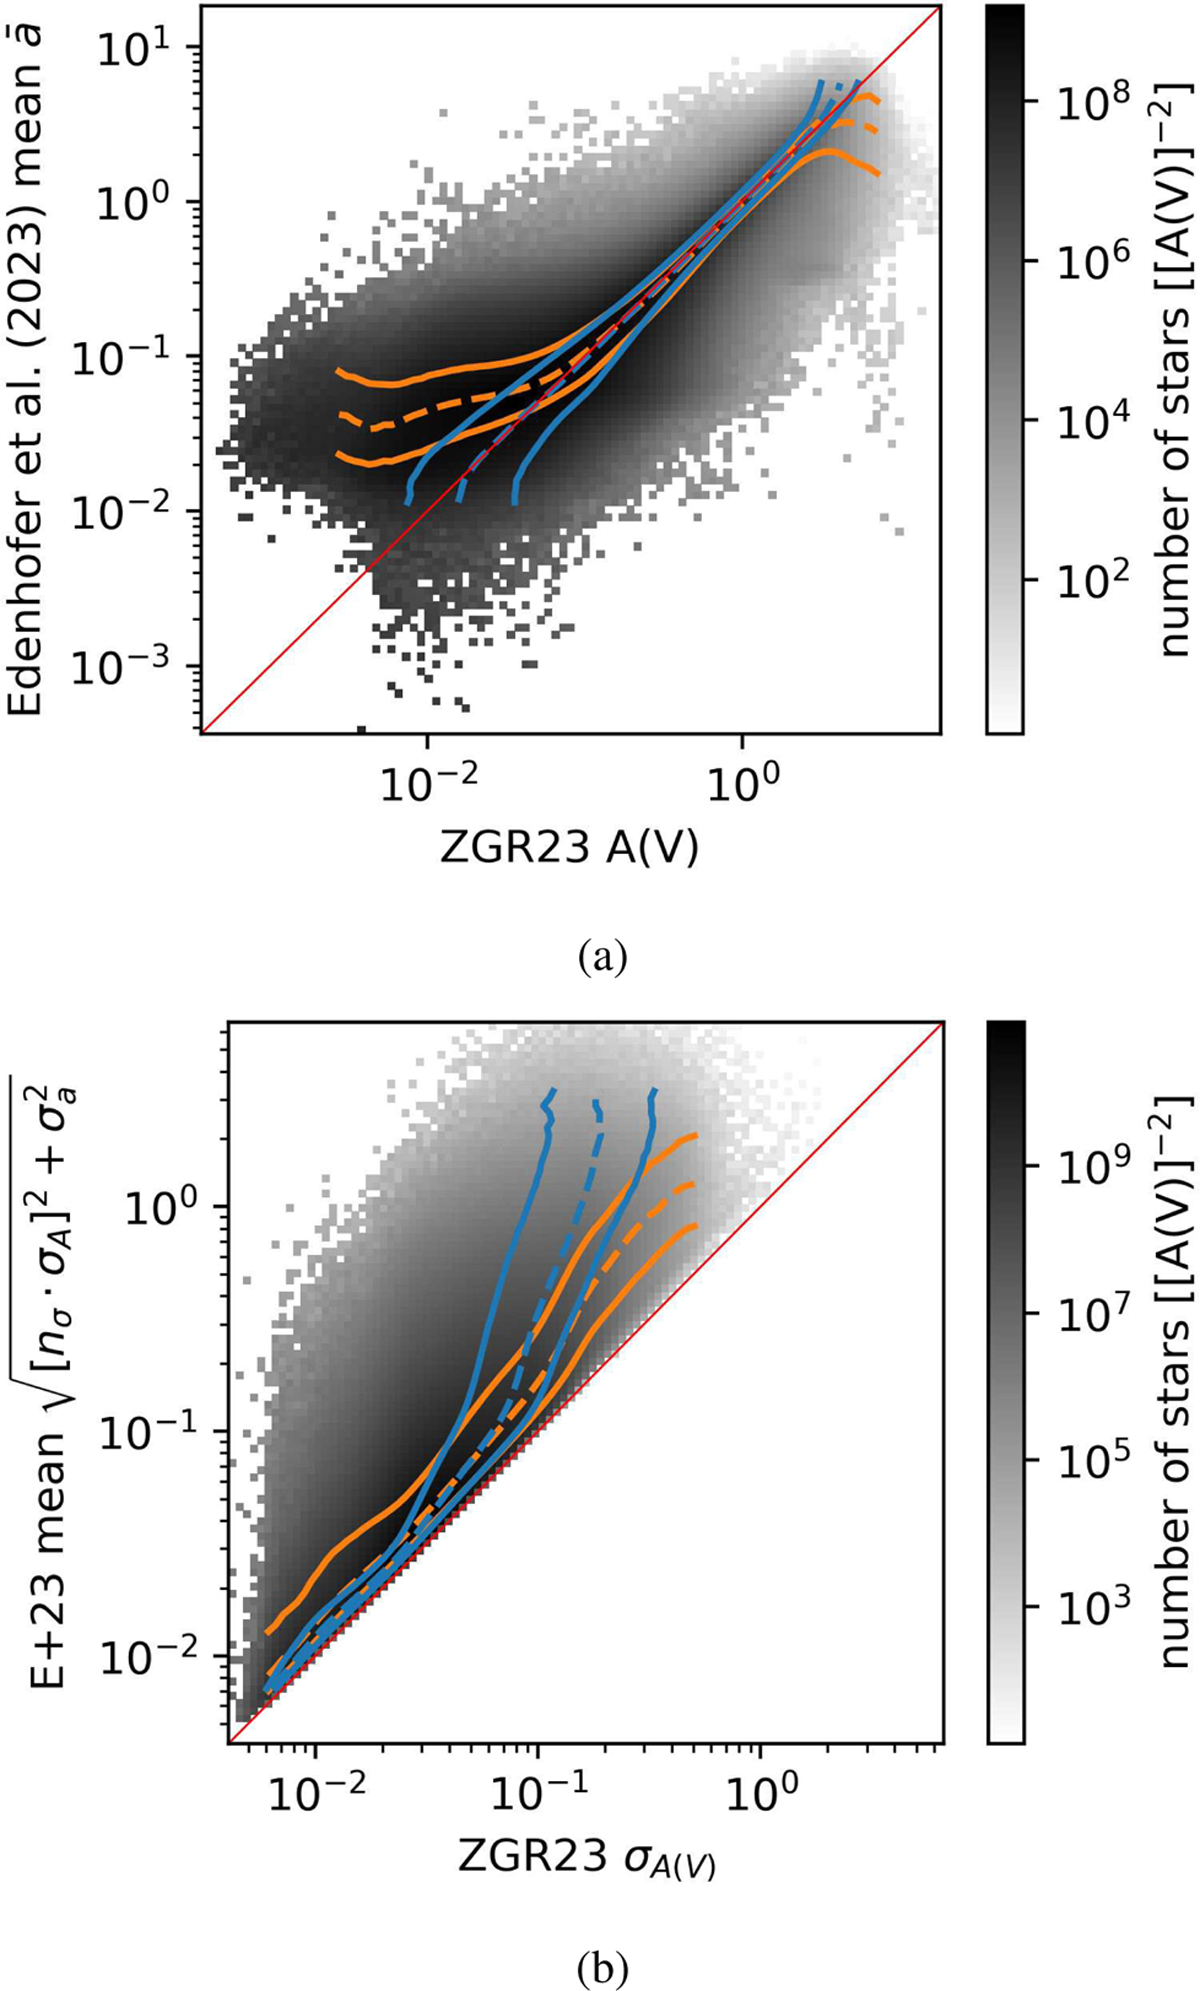
ZGR23's extinction versus our predicted extinction for Gaia BP/RP stars. Panel (a): Our mean posterior extinctions versus the ZGR23 extinctions to stars as 2D histogram. The 16th, 50th, and 84th quantiles of the ZGR23 extinctions for each bin of our mean extinction are shown as blue lines. The respective quantiles of our predictions in bins of the ZGR23 extinctions are shown as orange lines. Panel (b): Same comparison but for our posterior mean predictions for the ZGR23 measurement uncertainties, ![]() , versus the ZGR23 uncertainties. Note that the predictions for the ZGR23 measurement uncertainties are not the uncertainties of our extinction predictions. See Section 4 and in particular Eq. (18) for further details on the quantities shown here. The bisectors are shown in red. The colorbars are logarithmic.
, versus the ZGR23 uncertainties. Note that the predictions for the ZGR23 measurement uncertainties are not the uncertainties of our extinction predictions. See Section 4 and in particular Eq. (18) for further details on the quantities shown here. The bisectors are shown in red. The colorbars are logarithmic.
Current usage metrics show cumulative count of Article Views (full-text article views including HTML views, PDF and ePub downloads, according to the available data) and Abstracts Views on Vision4Press platform.
Data correspond to usage on the plateform after 2015. The current usage metrics is available 48-96 hours after online publication and is updated daily on week days.
Initial download of the metrics may take a while.