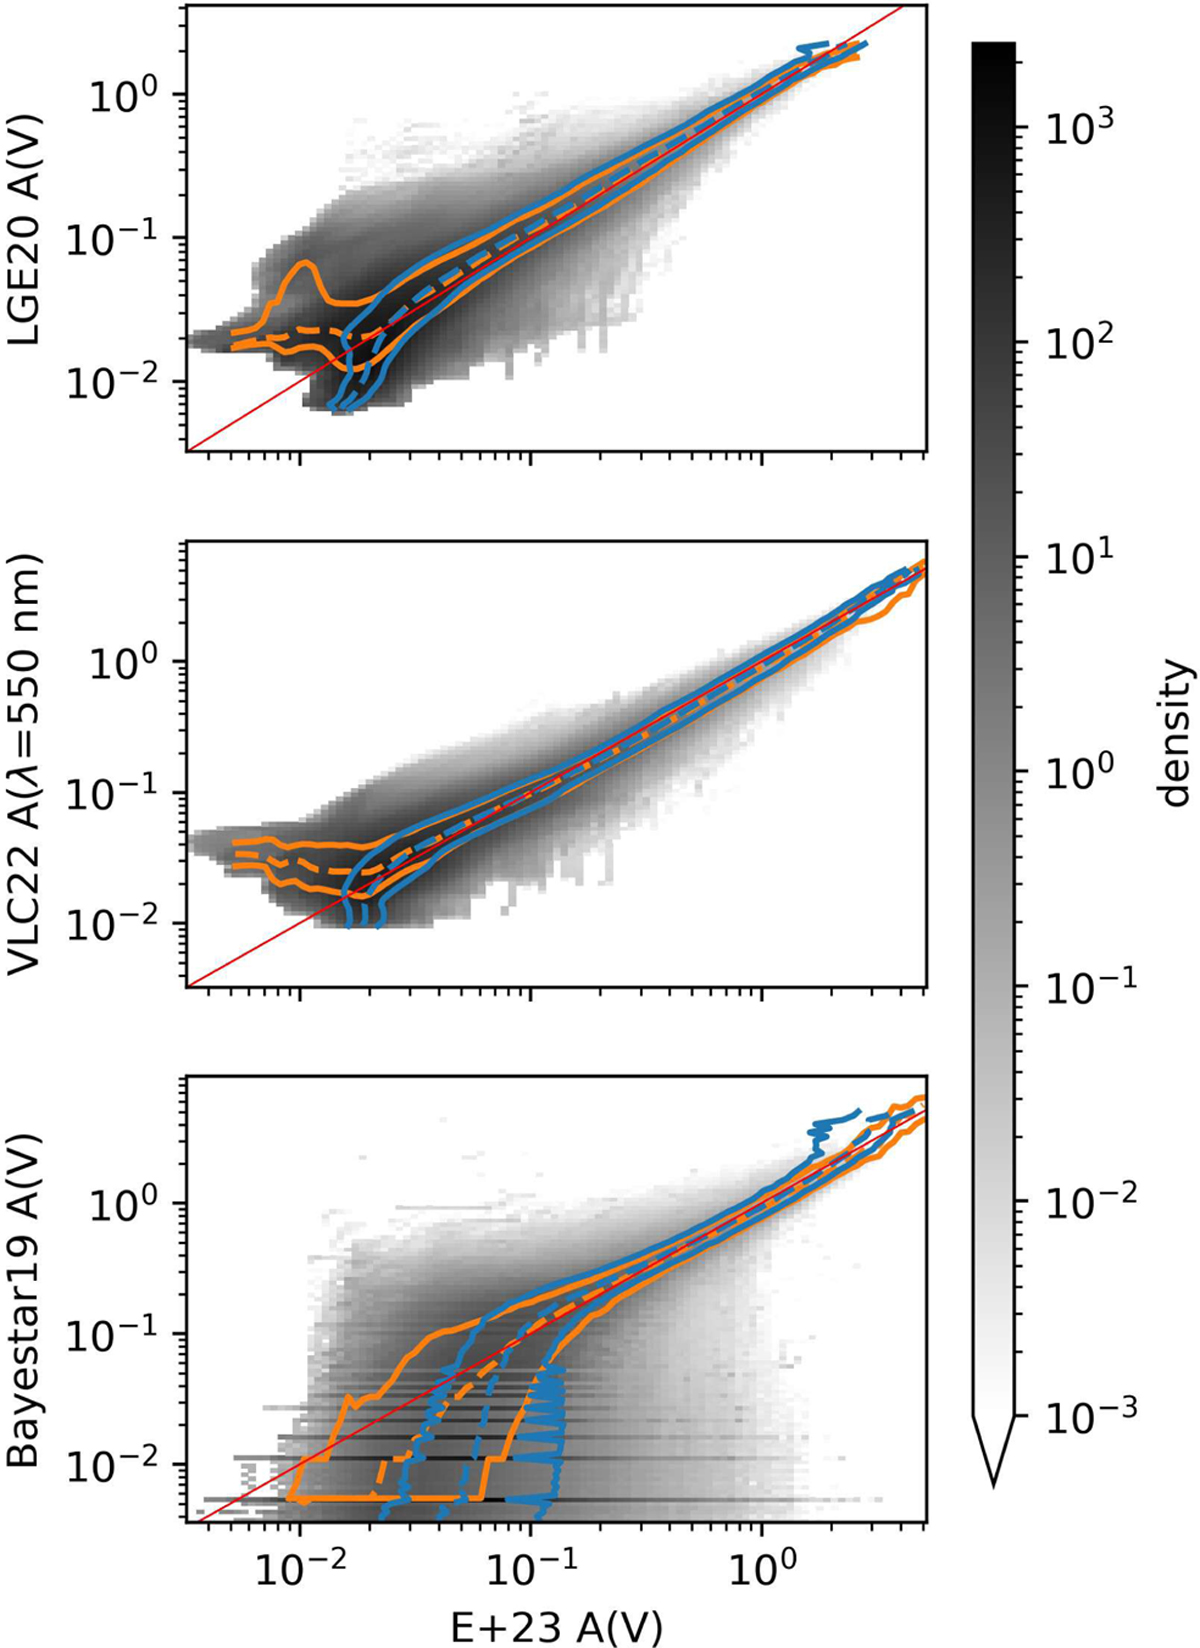
Fig. 10
Download original image
Histogram of the mean posterior extinction of our map versus LGE20, VLC22, and Bayestar19 for 58 million test points. For each pixel center of a HEALPix sphere with Nside = 64, 1182 test points are placed at 1 pc intervals in distance starting at 69 pc. The orange lines show the 16th, 50th, and 84th quantiles of the predicted extinction by LGE20, VLC22, and Bayestar19, respectively, for each bin of our mean extinction. The respective quantiles of our predictions in bins of the other reconstruction are shown as blue lines. The bisectors are shown in red. The colorbars are logarithmic and truncated at the lower end at 1 mmag.
Current usage metrics show cumulative count of Article Views (full-text article views including HTML views, PDF and ePub downloads, according to the available data) and Abstracts Views on Vision4Press platform.
Data correspond to usage on the plateform after 2015. The current usage metrics is available 48-96 hours after online publication and is updated daily on week days.
Initial download of the metrics may take a while.