Fig. 2
Download original image
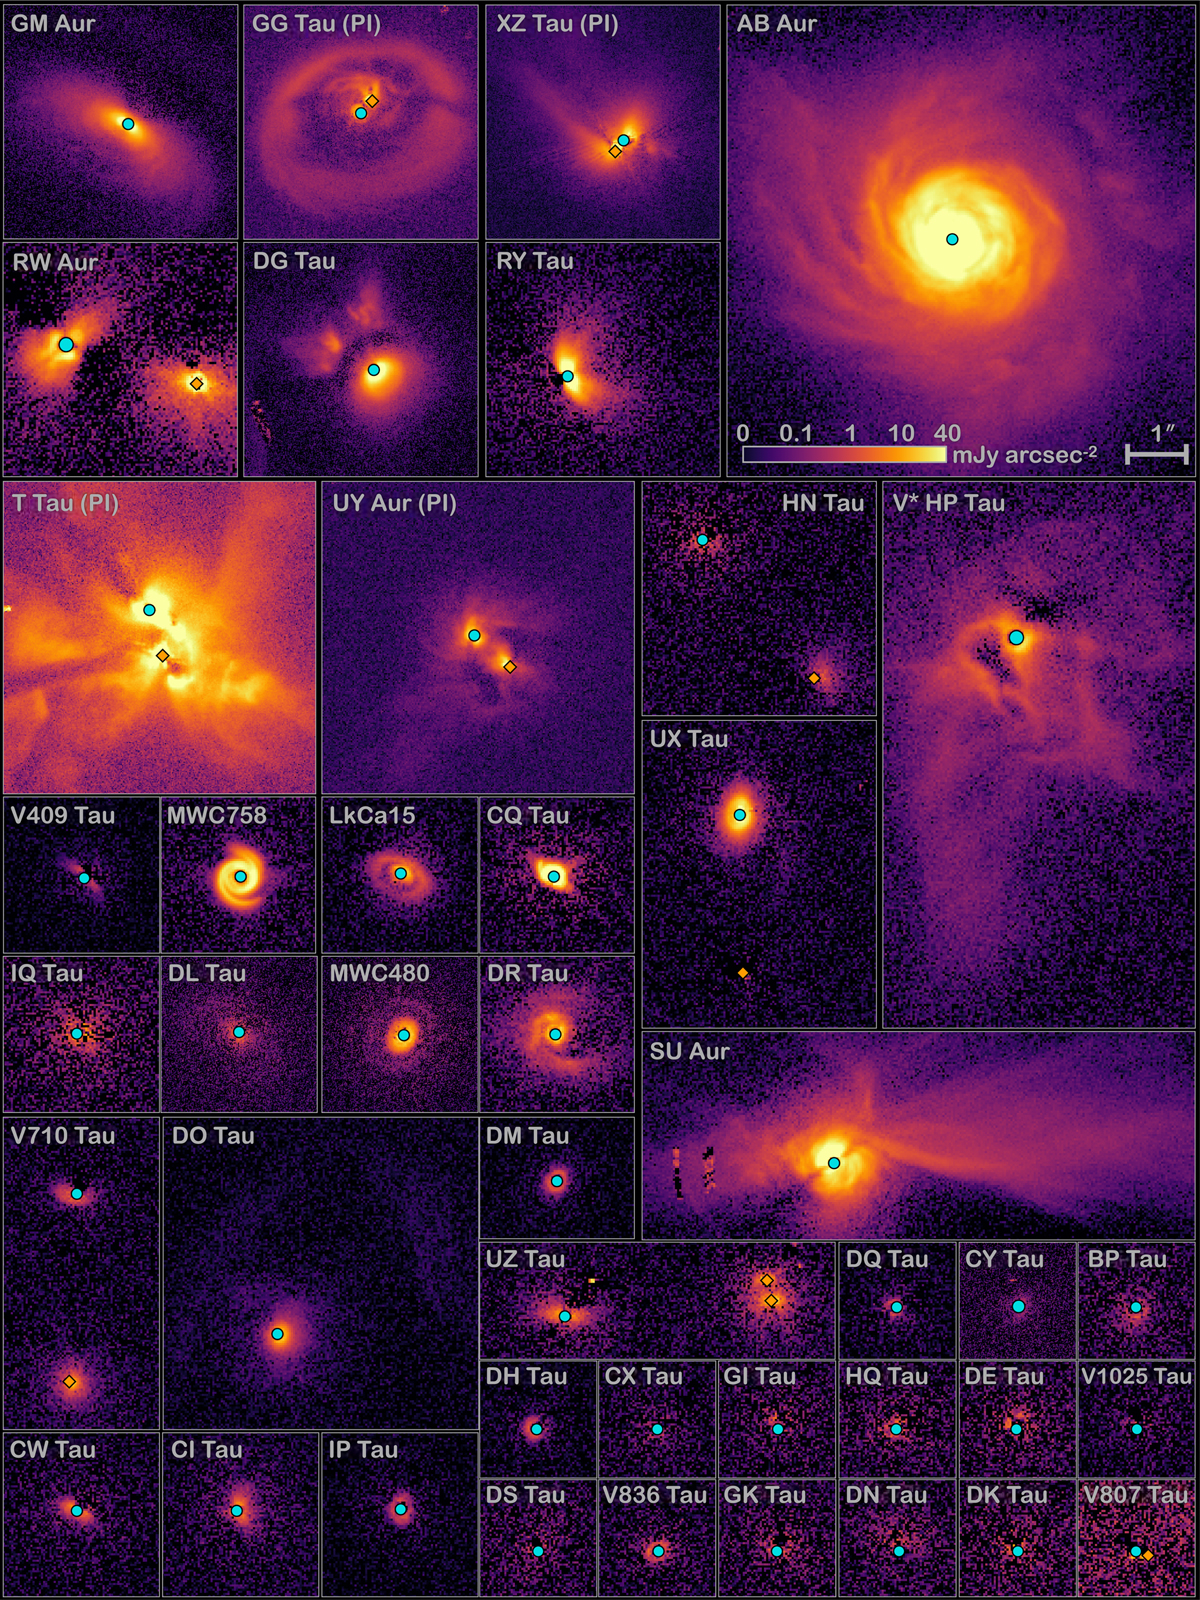
Imagery of sample. The polarization map of all sources is shown with the same angular and flux scales, as indicated in the top right panel. The Qϕ parameter is shown for all sources except GG Tau, XZ Tau, T Tau, and UY Aur, for which the PI parameter is shown. All primary stars masked by the coronagraph are indicated by a cyan circle, while all secondary stars are indicated by an orange diamond. Each panel is cropped to show all the significant flux detected. The only exception is T Tau, where flux is detected out to the detector edge and for which only the central region is shown. Stars are coarsely sorted by polarized light brightness.
Current usage metrics show cumulative count of Article Views (full-text article views including HTML views, PDF and ePub downloads, according to the available data) and Abstracts Views on Vision4Press platform.
Data correspond to usage on the plateform after 2015. The current usage metrics is available 48-96 hours after online publication and is updated daily on week days.
Initial download of the metrics may take a while.