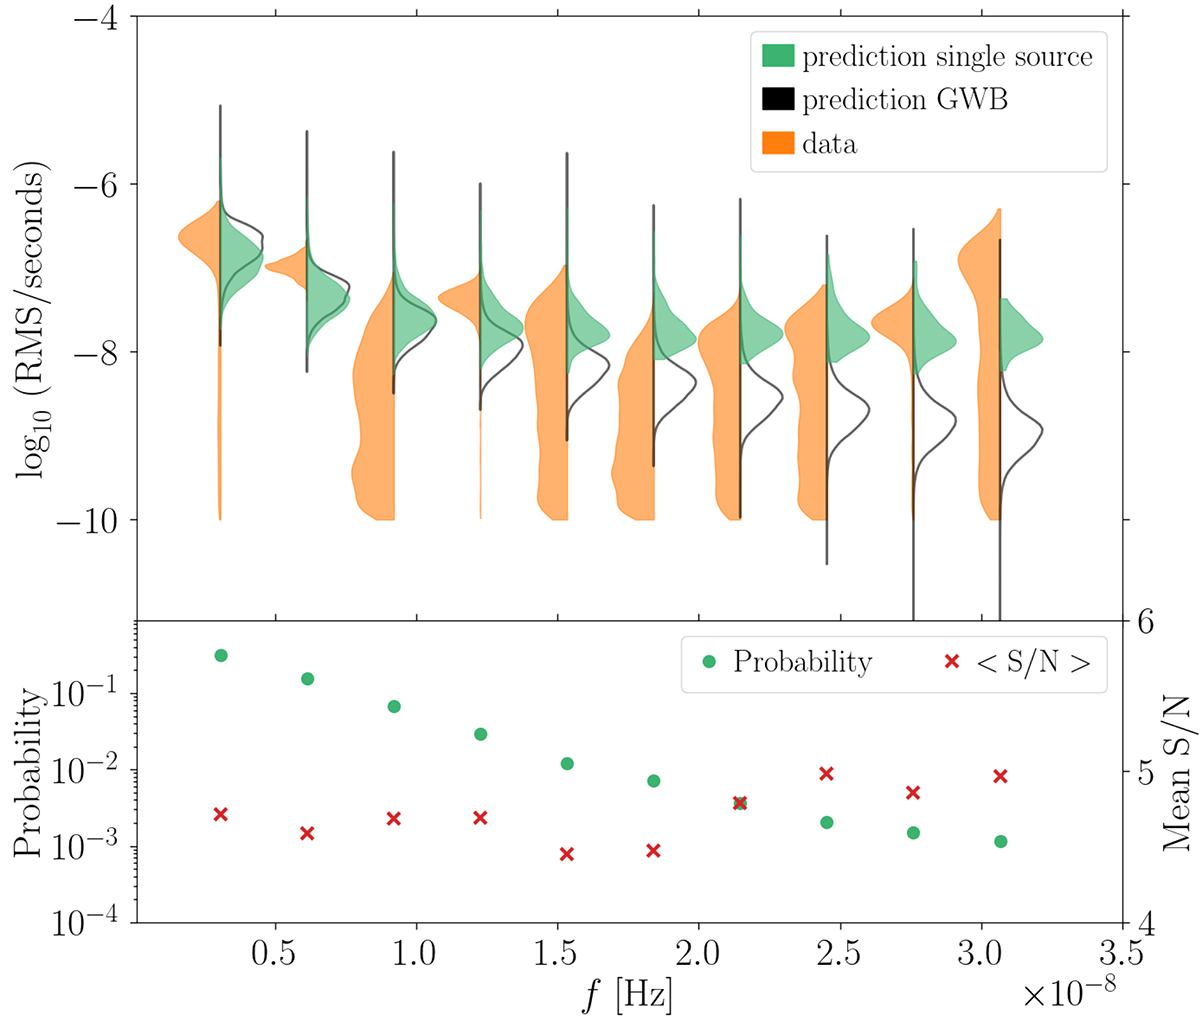
Fig. 4.
Download original image
Expected properties of CGWs as a function of frequency. Top panel: free spectrum violin plot comparing the measured signal (orange) to the power distribution of CGWs (green). Empty violins show the full GWB produced by the models for comparison. Bottom panel: the probability of detecting a CGW with S/N > 3 as a function of frequency (green circles, left y-axis scale). The average S/N of CGWs is also shown as red crosses (right y-axis scale).
Current usage metrics show cumulative count of Article Views (full-text article views including HTML views, PDF and ePub downloads, according to the available data) and Abstracts Views on Vision4Press platform.
Data correspond to usage on the plateform after 2015. The current usage metrics is available 48-96 hours after online publication and is updated daily on week days.
Initial download of the metrics may take a while.