Open Access
Fig. 3.
Download original image
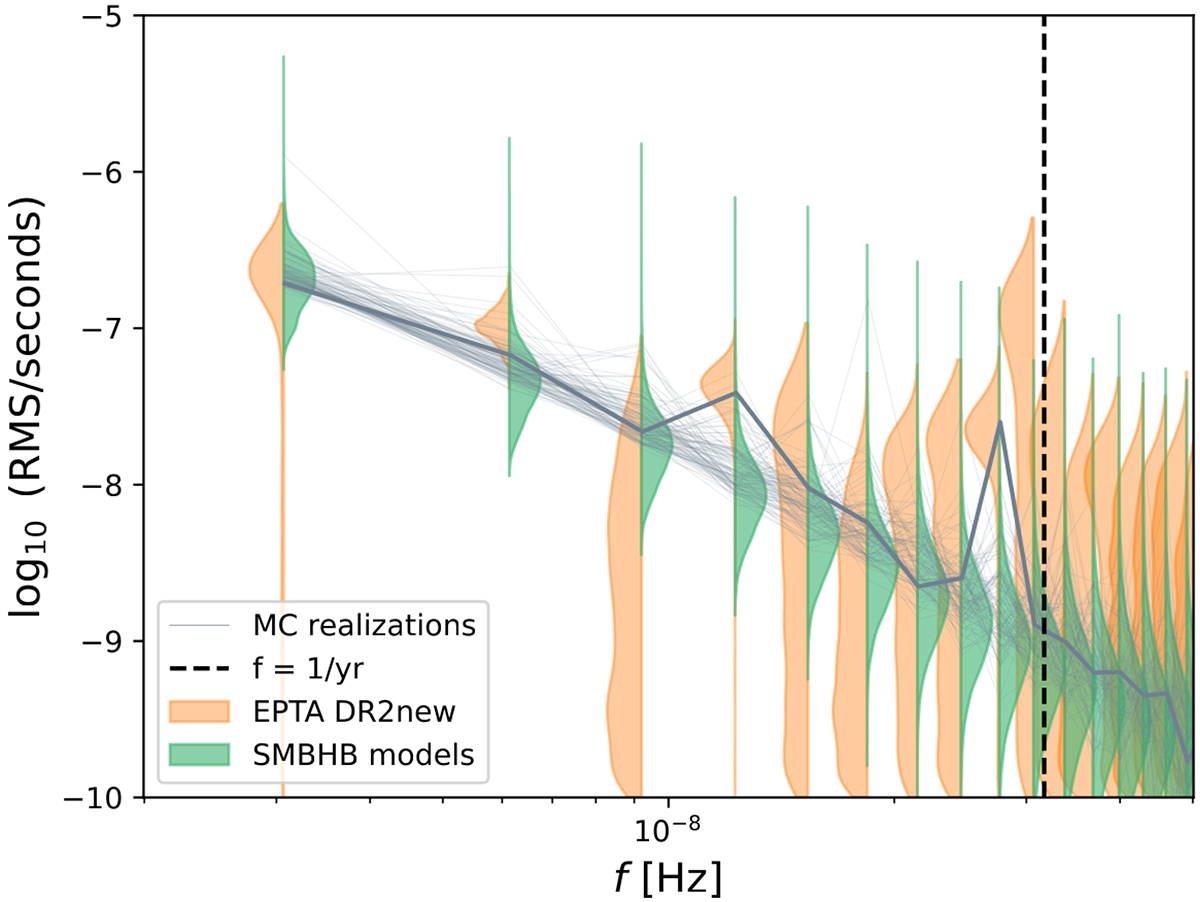
Free spectrum violin plot comparing measured (orange) and expected (green) signals. Overlaid to the violins are the 100 Monte Carlo realizations of one specific model; among those, the thick one represents an example of a SMBHB signal consistent with the excess power measured in the data at all frequencies.
Current usage metrics show cumulative count of Article Views (full-text article views including HTML views, PDF and ePub downloads, according to the available data) and Abstracts Views on Vision4Press platform.
Data correspond to usage on the plateform after 2015. The current usage metrics is available 48-96 hours after online publication and is updated daily on week days.
Initial download of the metrics may take a while.