Fig. 22.
Download original image
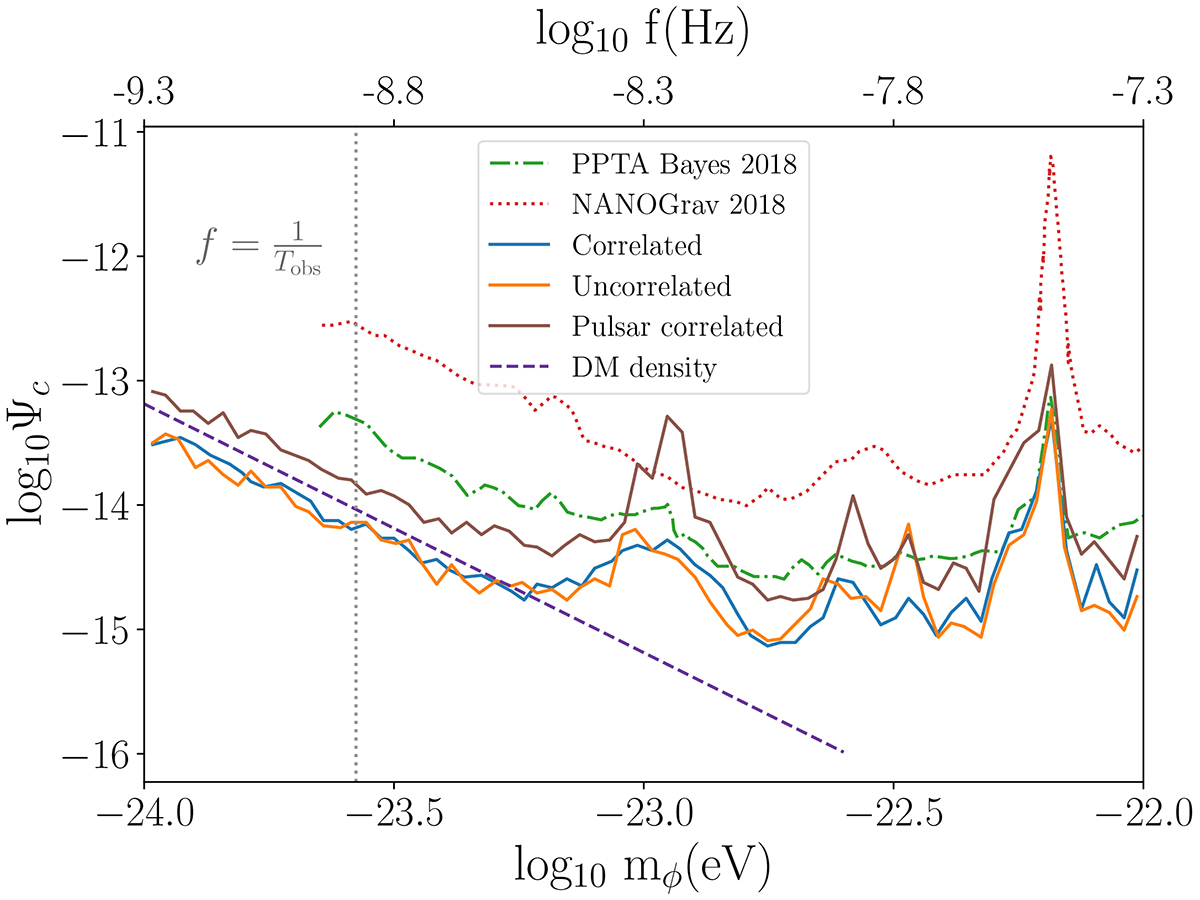
Constraints on Ψc as a function of mϕ using the EPTA DR2new dataset from Paper III. Previous analyses are shown for comparison, cf. Porayko & Postnov (2014), Porayko et al. (2018) for further details. The blue, orange and brown lines represent the 95% Bayesian upper limit on Ψc obtained from the EPTA DR2new dataset with the correlated, uncorrelated and pulsar correlated analysis, respectively. The purple line shows the expected ULDM abundance computed from Eq. (32).
Current usage metrics show cumulative count of Article Views (full-text article views including HTML views, PDF and ePub downloads, according to the available data) and Abstracts Views on Vision4Press platform.
Data correspond to usage on the plateform after 2015. The current usage metrics is available 48-96 hours after online publication and is updated daily on week days.
Initial download of the metrics may take a while.