Fig. 20.
Download original image
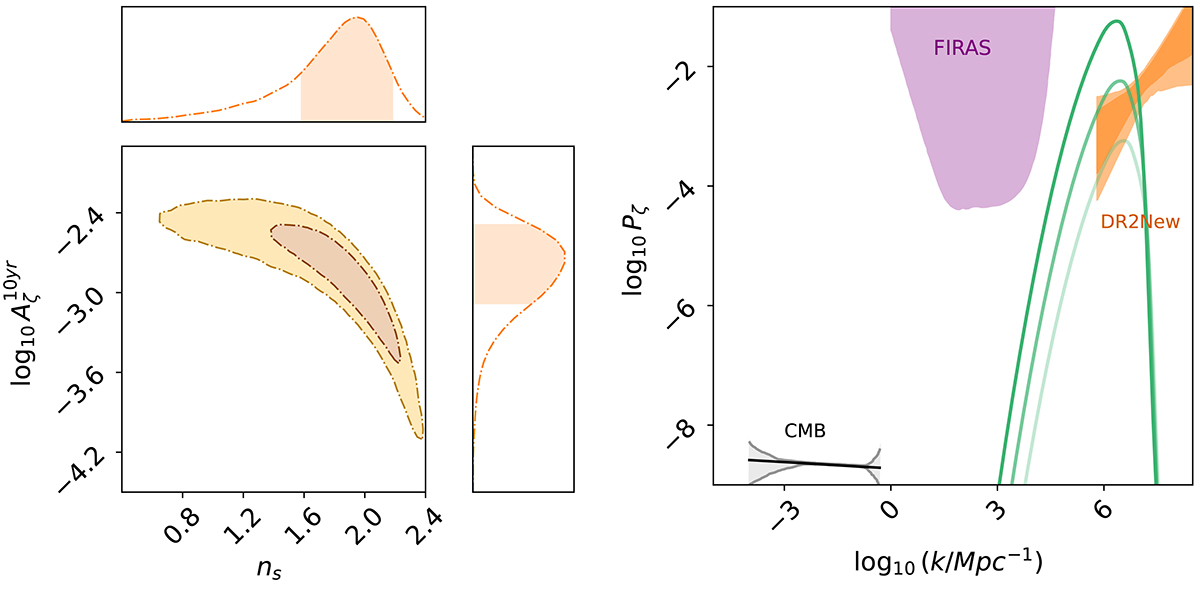
Results for the power-law model of the curvature perturbations described by Eq. (25). Left panel: 1σ and 2σ contours of the posterior distributions on the amplitude Aζ and the slope of the power spectrum ns obtained by the analysis of DR2New. Right panel: 1σ and 2σ contours of the power spectra inferred from the DR2New analysis by picking 1000 random samples from the posteriors overlaid with the current constraints on the primordial power spectrum using the latest Planck data. The grey colour depicts the 2σ-confidence intervals. The green lines and purple shaded areas are the same as in Fig. 19.
Current usage metrics show cumulative count of Article Views (full-text article views including HTML views, PDF and ePub downloads, according to the available data) and Abstracts Views on Vision4Press platform.
Data correspond to usage on the plateform after 2015. The current usage metrics is available 48-96 hours after online publication and is updated daily on week days.
Initial download of the metrics may take a while.