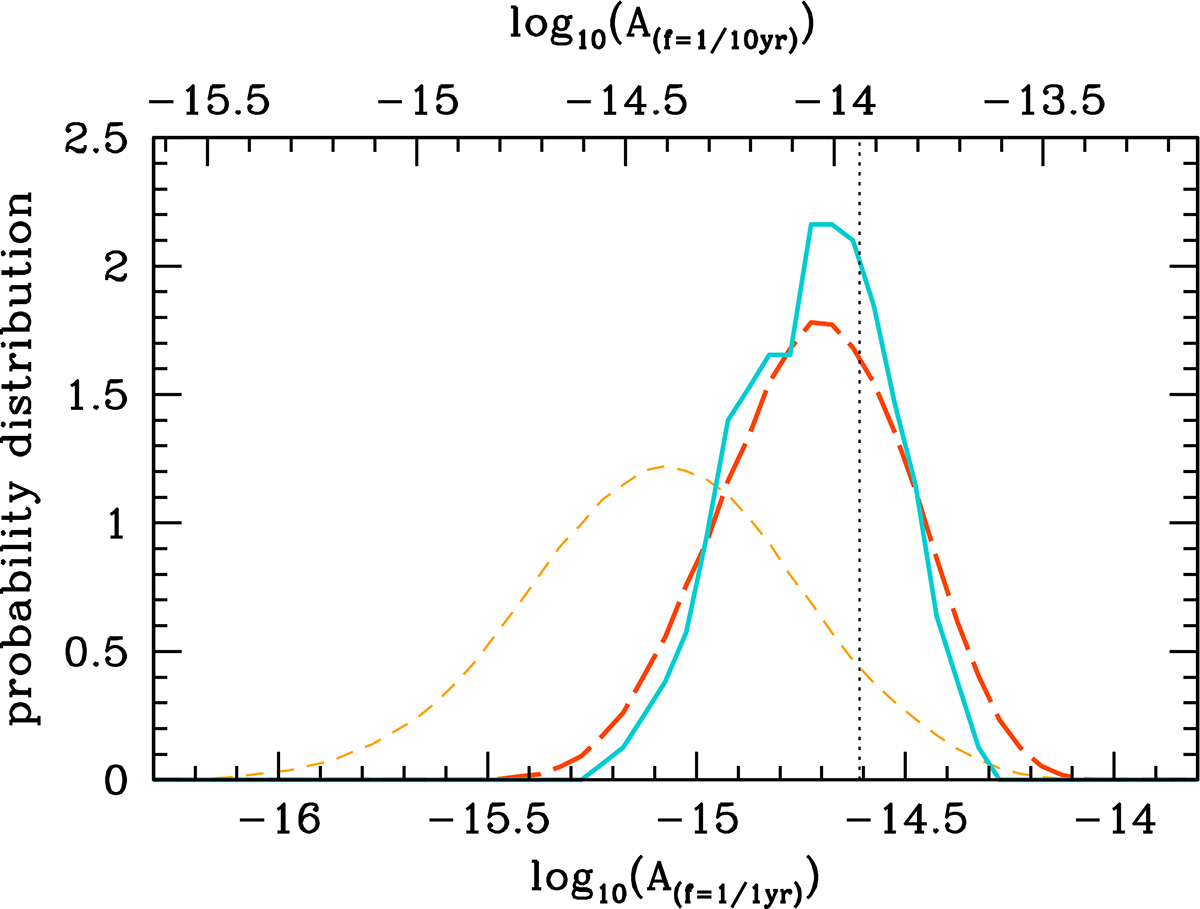
Fig. 2.
Download original image
GWB amplitude distributions predicted by the RSG15 models. The thin-dashed yellow line is for the full set of models in RSG15, whereas the thick-dashed orange line is for the subset considered here. The solid blue line is the distribution predicted by the 108 down-selected sample used in the analysis. The vertical line marks the median value of A at f0 = 1 yr−1 reported in Paper III when fixing γ = 13/3 in the search. Note that the lower x-axis scale is for A at f0 = 1 yr−1, whereas the upper x-axis is for A at f0 = 10 yr−1 (the normalization used in this paper). Since α = −2/3 for circular GW-driven binaries, there is a shift of 0.666 dex between the two.
Current usage metrics show cumulative count of Article Views (full-text article views including HTML views, PDF and ePub downloads, according to the available data) and Abstracts Views on Vision4Press platform.
Data correspond to usage on the plateform after 2015. The current usage metrics is available 48-96 hours after online publication and is updated daily on week days.
Initial download of the metrics may take a while.