Fig. 16.

Download original image
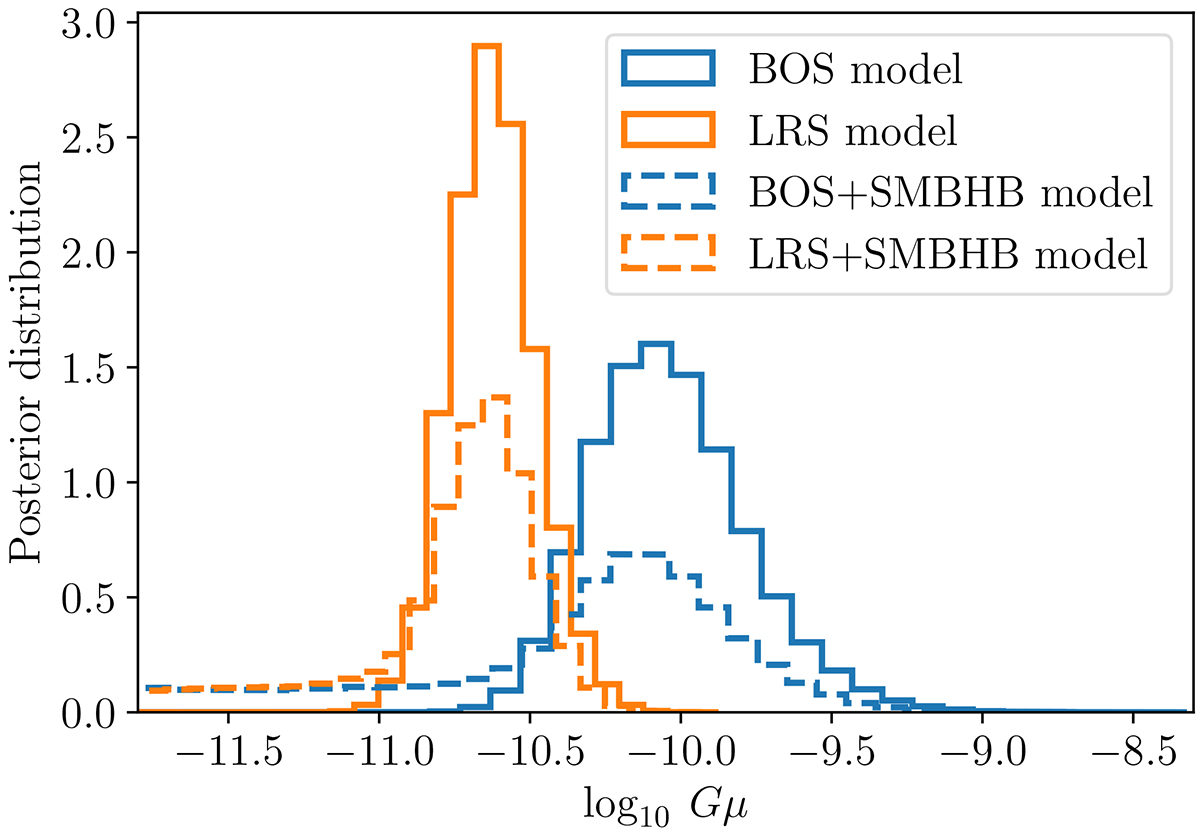
SGWB spectra (in terms of log10h2Ωgw) for four different early Universe SGWB models considered in this paper. BOS/LRS correspond to a cosmic string background with Nc = 2 and Nk = 0 (Γ = 57), and log10Gμ = −10.1/−10.6. The GWB from turbulence is plotted in solid line for λ*ℋ* = 1, Ω* = 0.3, and T* = 140 MeV. The inflationary spectra is shown for log10r = −13.1 and nT = 2.4 (maximum a posteriori value). Power spectrum of the 2nd-order GWB from the scalar curvature perturbations described by the powerlaw model with ![]() and ns = 2.1 is shown with brown puncture-dot line. The nine first Fourier bins posteriors of the common signal are represented by the grey violin areas.
and ns = 2.1 is shown with brown puncture-dot line. The nine first Fourier bins posteriors of the common signal are represented by the grey violin areas.
Current usage metrics show cumulative count of Article Views (full-text article views including HTML views, PDF and ePub downloads, according to the available data) and Abstracts Views on Vision4Press platform.
Data correspond to usage on the plateform after 2015. The current usage metrics is available 48-96 hours after online publication and is updated daily on week days.
Initial download of the metrics may take a while.


