Fig. 15.
Download original image
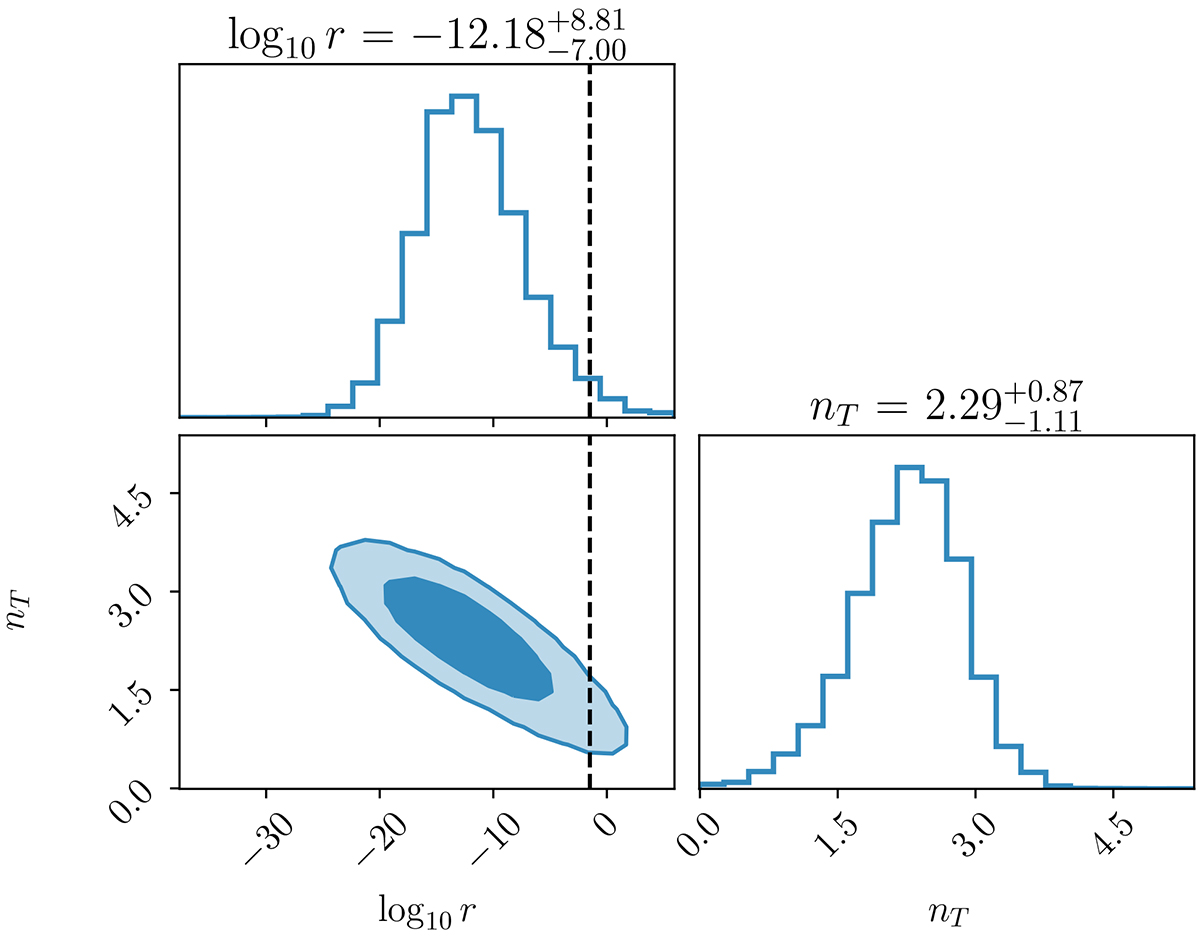
2D posteriors of the tensor-to-scalar ratio (in log10) and the fractional energy density spectral index nT in the PTA frequency range. The 68% and 95% credible regions are displayed. The black dashed line represents the tensor-to-scalar ratio upper bound found in Tristram et al. (2022) assuming single-field slow-roll inflation.
Current usage metrics show cumulative count of Article Views (full-text article views including HTML views, PDF and ePub downloads, according to the available data) and Abstracts Views on Vision4Press platform.
Data correspond to usage on the plateform after 2015. The current usage metrics is available 48-96 hours after online publication and is updated daily on week days.
Initial download of the metrics may take a while.