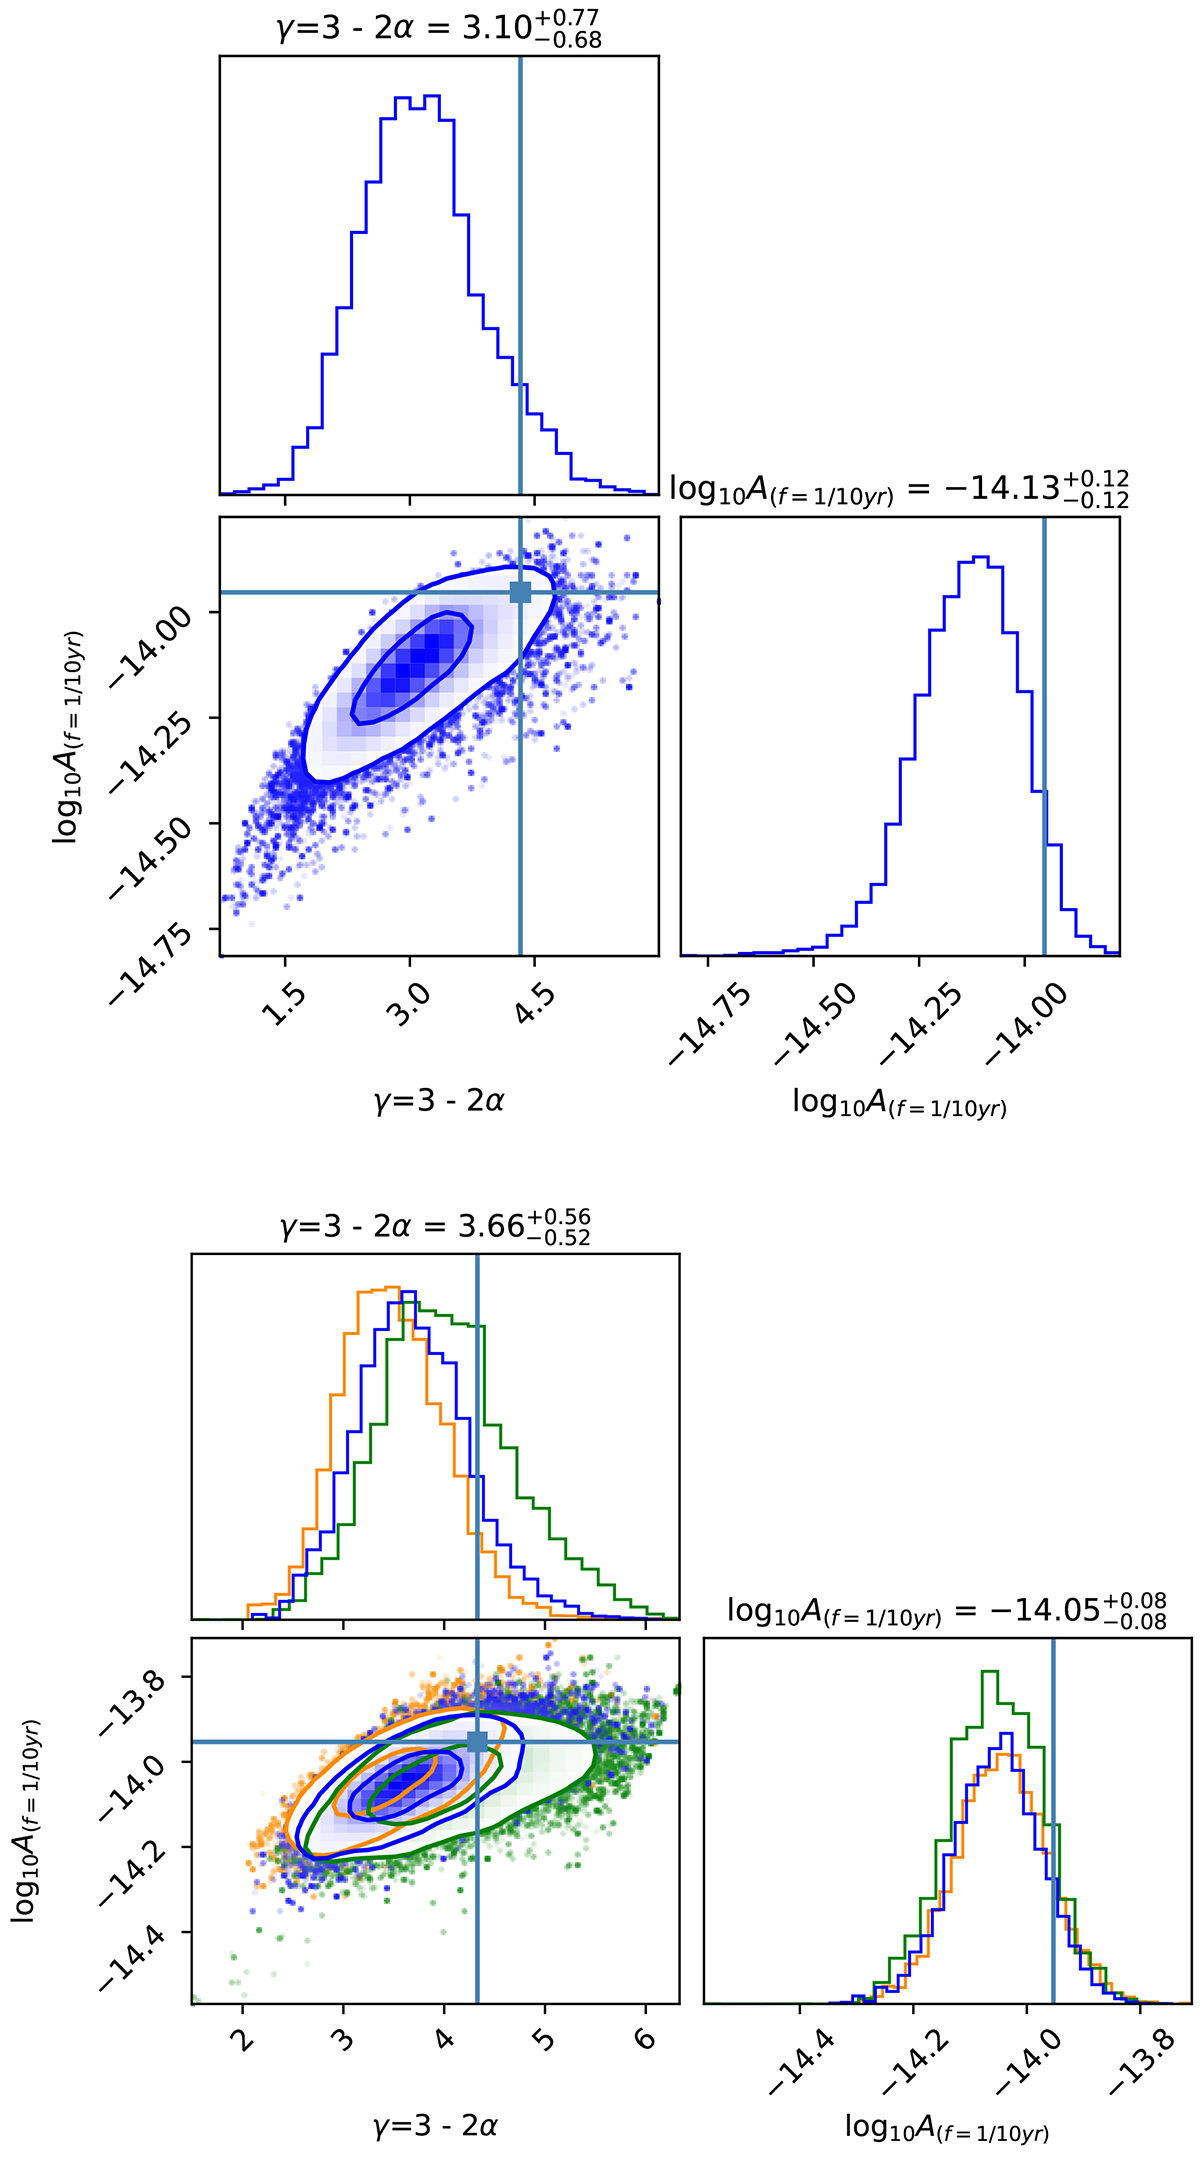
Fig. 14.
Download original image
Posterior distributions of the recovered GWB from injections on synthetic data mimicking DR2new. Top panel: statistical offset in an ideal dataset. The square marks the injected value and the blue contours are 1σ and 2σ of the recovered posterior. Bottom panel: effect of high-frequency noise mismodeling on the recovery. The orange, blue and green contours are respectively obtained when EFAC = 0.8, 1, 1.2 are used for the recovery (injected EFAC = 1).
Current usage metrics show cumulative count of Article Views (full-text article views including HTML views, PDF and ePub downloads, according to the available data) and Abstracts Views on Vision4Press platform.
Data correspond to usage on the plateform after 2015. The current usage metrics is available 48-96 hours after online publication and is updated daily on week days.
Initial download of the metrics may take a while.