Fig. 1.
Download original image
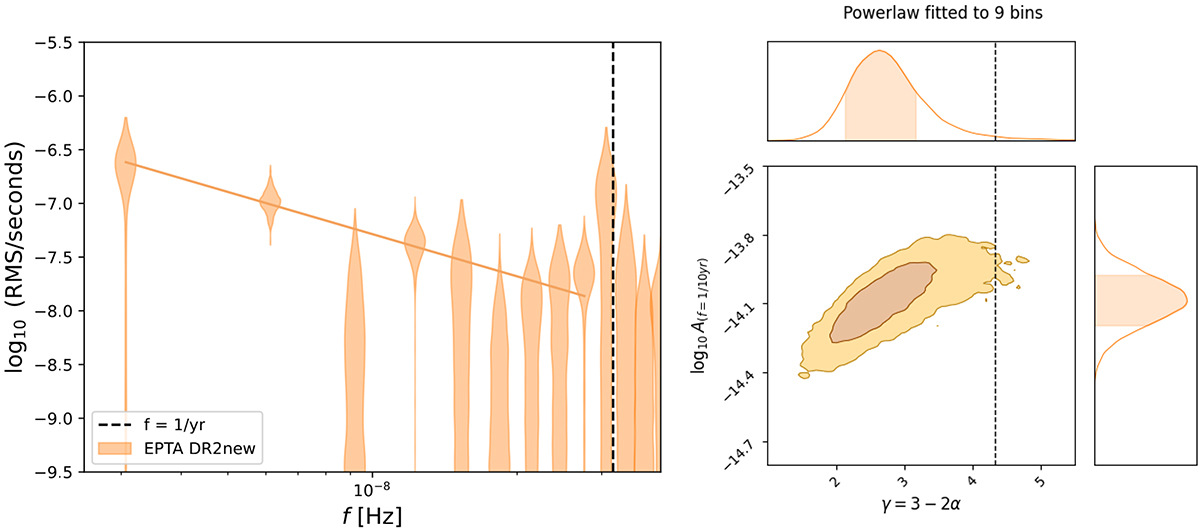
Properties of the common correlated signal detected in DR2new. Left panel: free spectrum of the RMS induced by the excess correlated signal in each frequency resolution bin (with width defined by the inverse of the data span, Δf = T−1). The straight line is the best power-law fit to the data. Right panel: joint posterior distribution in the A − γ plane. Note that we normalise A to a pivotal frequency f0 = 10 yr−1.
Current usage metrics show cumulative count of Article Views (full-text article views including HTML views, PDF and ePub downloads, according to the available data) and Abstracts Views on Vision4Press platform.
Data correspond to usage on the plateform after 2015. The current usage metrics is available 48-96 hours after online publication and is updated daily on week days.
Initial download of the metrics may take a while.