Fig. 4.
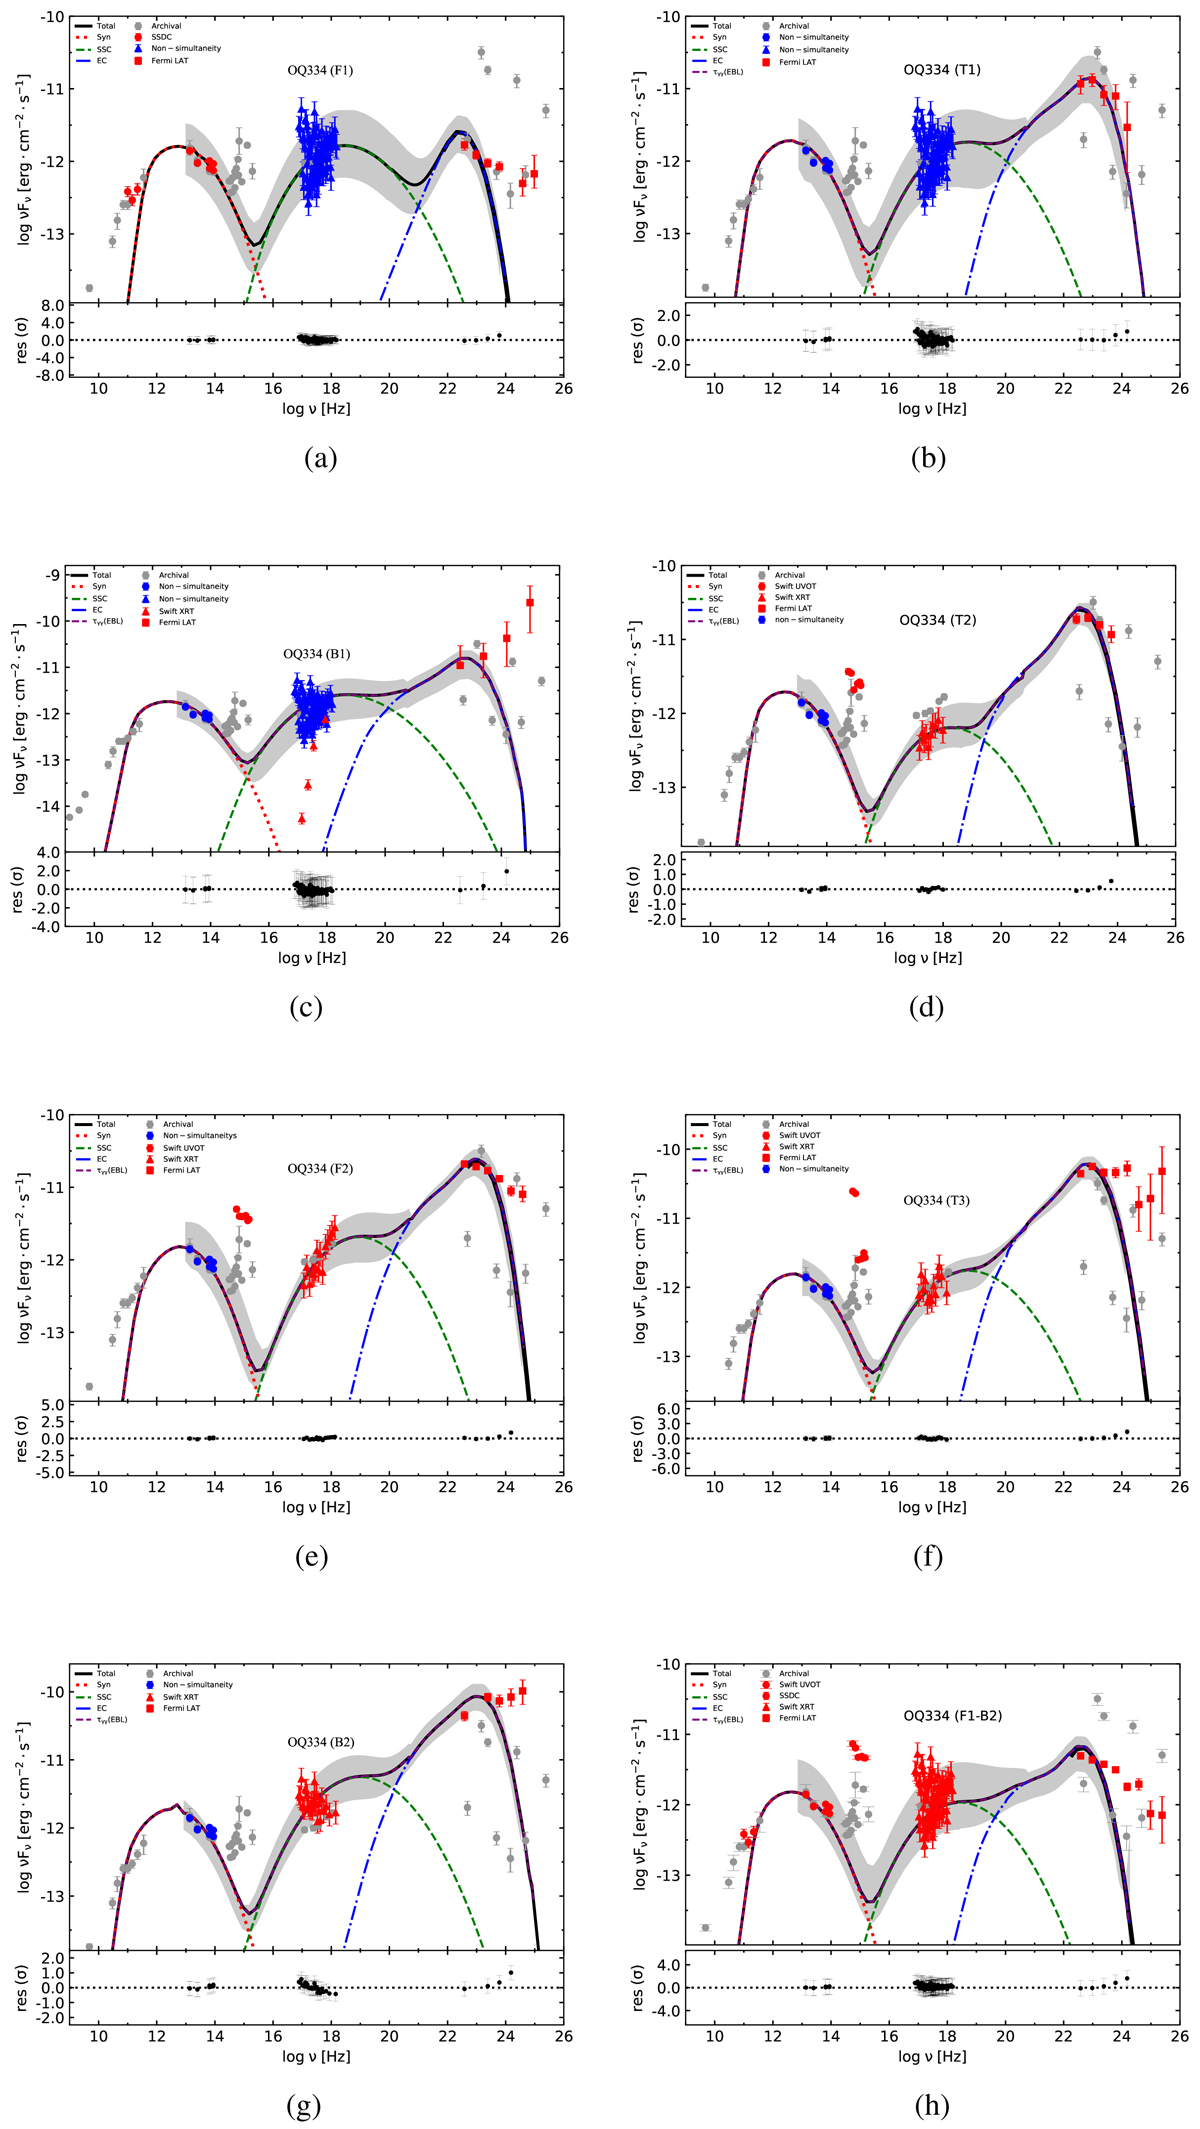
Download original image
Multi-wavelength SED of the CL phenomenon. The dotted red, dashed green, dot-dashed blue, and dashed purple lines represent the Syn, SSC, EC, and EBL absorption, respectively. The solid black line represents the total spectrum of the SED fit. The red dots represent quasi-simultaneous data. Blue dots represent non-quasi-simultaneous data. Grey dots represent archival data. In these subgraphs, F1, T1, B1, T2, F2, T3, and B2 represent the SED in each state of the CL phenomenon, and F1-B2 represents the SED of the entire CL phenomenon. The grey background represents the 1σ parameter space of the SED model and is displayed starting from the optical observation data points participating in the fit. The lower panel of each subplot shows the residual of the fit. (a) The FSRQ state in MJD 54628−58082. (b) FSRQ conversion to BL Lac state in MJD 58083−58121. (c) The BL Lac state in MJD 58122−58124. (d) BL Lac conversion to FSRQ state in MJD 58125-58220. (e) The FSRQ state in MJD 58221−58637. (f) FSRQ conversion to BL Lac state in MJD 58638−58664. (g) The BL Lac state in MJD 58665-58677. (h) The CL blazar state in MJD 54628−58677.
Current usage metrics show cumulative count of Article Views (full-text article views including HTML views, PDF and ePub downloads, according to the available data) and Abstracts Views on Vision4Press platform.
Data correspond to usage on the plateform after 2015. The current usage metrics is available 48-96 hours after online publication and is updated daily on week days.
Initial download of the metrics may take a while.