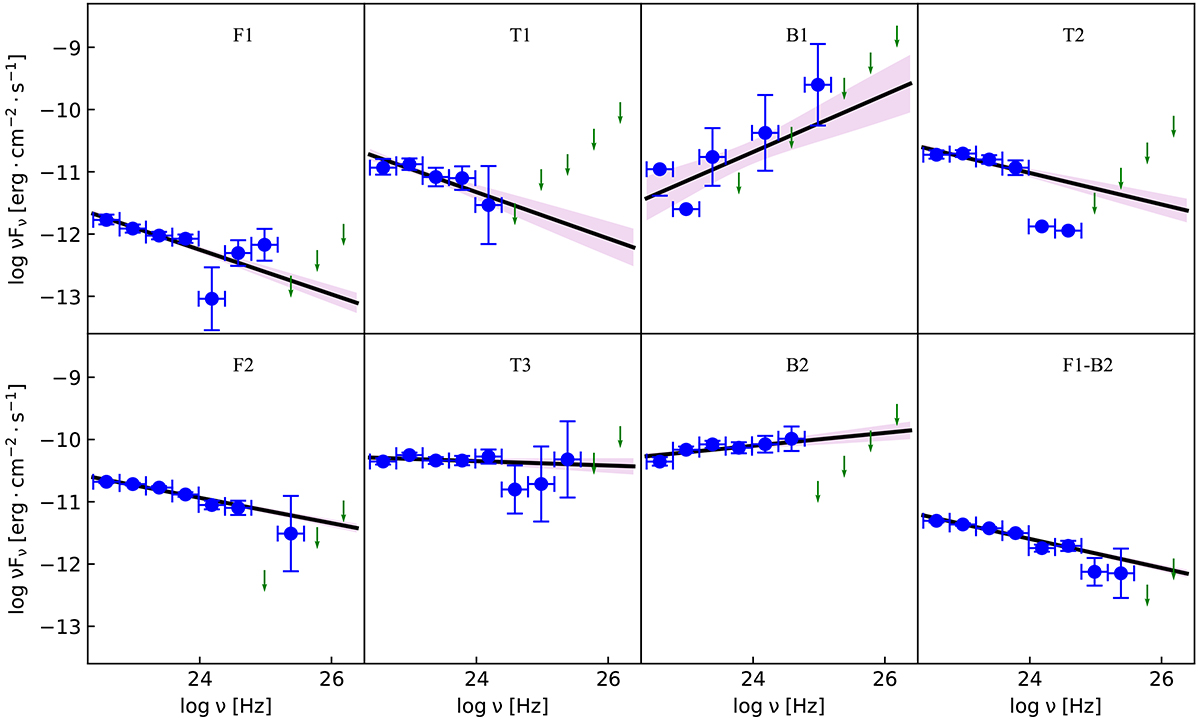
Fig. 3.
Download original image
Fermi-LAT SED for the CL phenomenon. The solid black line is the best fit for the likelihood analysis over the entire energy range. The blue dots are γ-ray data points, and the green downward arrows indicate the upper energy limit. The purple area is the 1σ confidence band. The ‘letters + numbers’ in each subgraph correspond to the status in Table 1.
Current usage metrics show cumulative count of Article Views (full-text article views including HTML views, PDF and ePub downloads, according to the available data) and Abstracts Views on Vision4Press platform.
Data correspond to usage on the plateform after 2015. The current usage metrics is available 48-96 hours after online publication and is updated daily on week days.
Initial download of the metrics may take a while.