Fig. 2.
Download original image
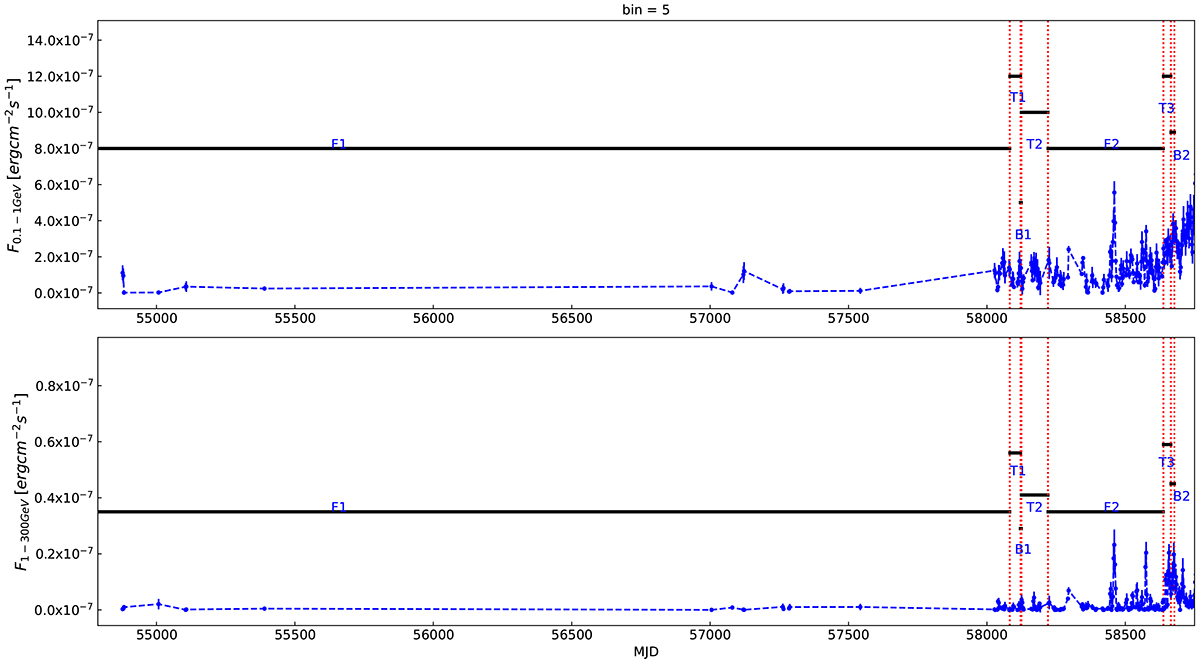
Fermi-LAT at MJD 54628−58677 (bin = 5 days). The flux in the 0.1–1 GeV band is indicated by F0.1 − 1 GeV (top panel). Flux in the 1–300 GeV band is expressed as F1 − 300 GeV (bottom panel). The range of the light curve corresponding to F1, T1, B1, T2, F2, T3, and B2 of the CL phenomenon is marked by black segments. The data points below certain TS ≤ 15 are removed.
Current usage metrics show cumulative count of Article Views (full-text article views including HTML views, PDF and ePub downloads, according to the available data) and Abstracts Views on Vision4Press platform.
Data correspond to usage on the plateform after 2015. The current usage metrics is available 48-96 hours after online publication and is updated daily on week days.
Initial download of the metrics may take a while.