Open Access
Fig. 9
Download original image
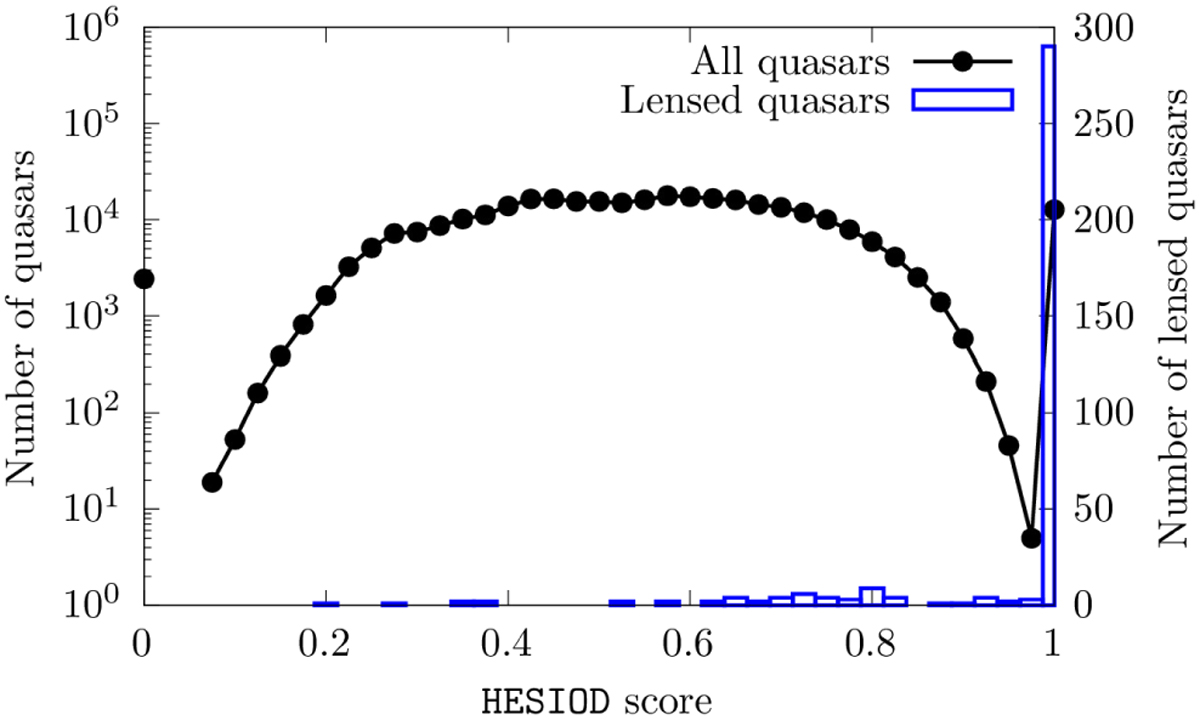
Distribution of the HESIOD score for the 319 296 QSOs for which it was computed. We note that the left axis corresponds to all the QSOs and is represented in logarithmic scale, while the right axis corresponds to the known lenses and is represented in linear scale.
Current usage metrics show cumulative count of Article Views (full-text article views including HTML views, PDF and ePub downloads, according to the available data) and Abstracts Views on Vision4Press platform.
Data correspond to usage on the plateform after 2015. The current usage metrics is available 48-96 hours after online publication and is updated daily on week days.
Initial download of the metrics may take a while.