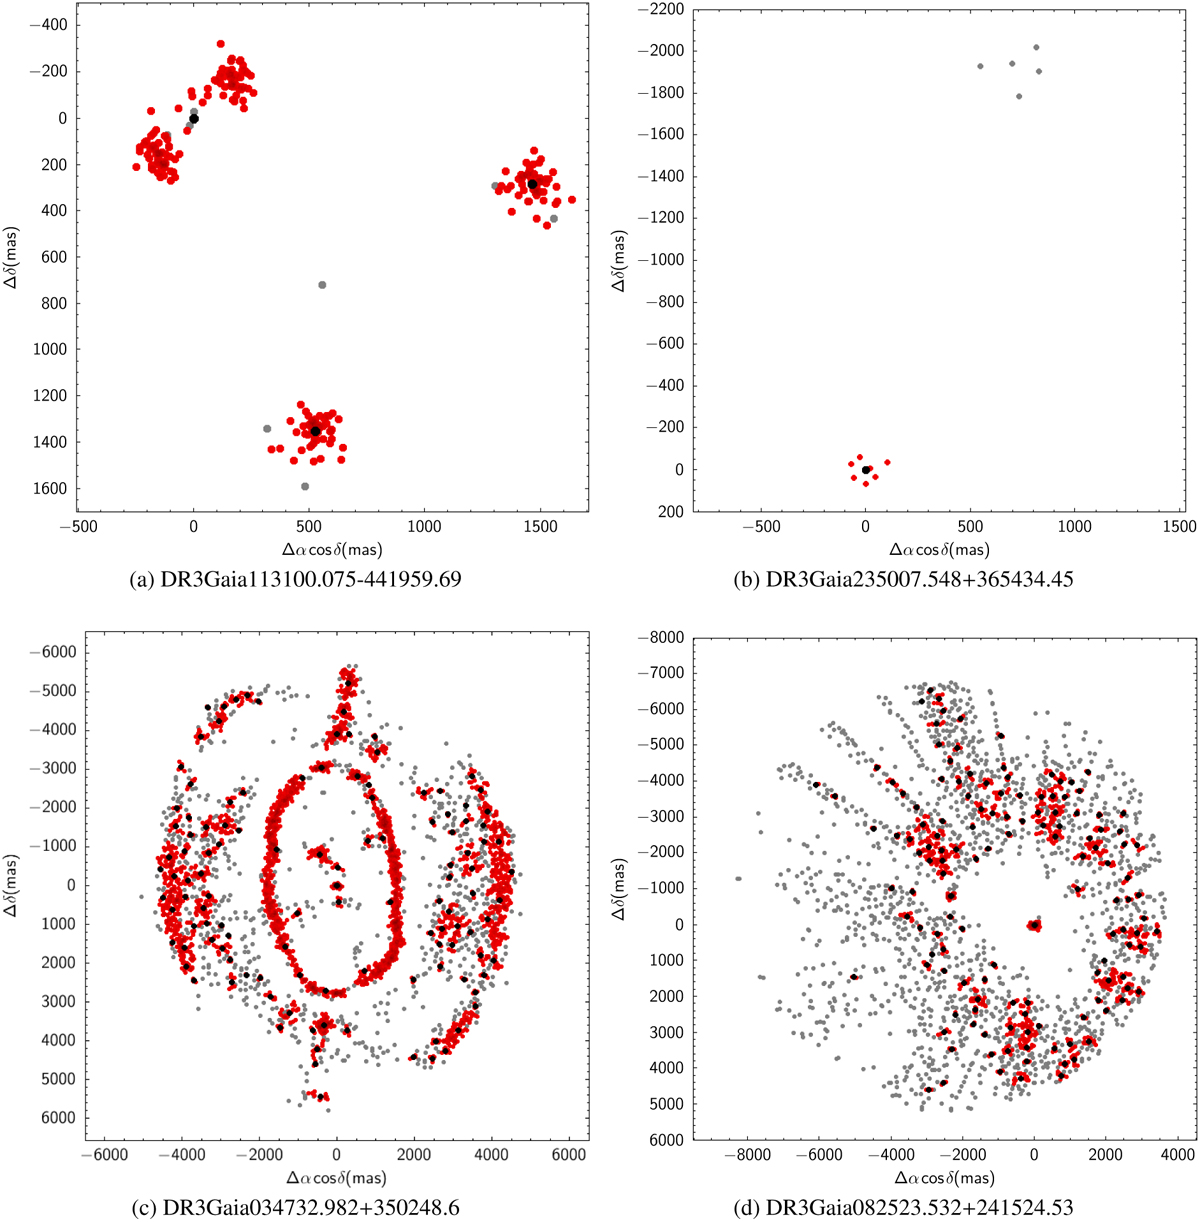
Fig. 4
Download original image
Examples of known issues. Black dots are the mean positions of the components, red points correspond to individual observations no matter the component and grey dots are outliers. In (c), a planetary nebula (IC 351) that unduly entered in the QSO catalogue is decomposed by the algorithm into numerous sources. as well as in (d) for the halo of a bright star.
Current usage metrics show cumulative count of Article Views (full-text article views including HTML views, PDF and ePub downloads, according to the available data) and Abstracts Views on Vision4Press platform.
Data correspond to usage on the plateform after 2015. The current usage metrics is available 48-96 hours after online publication and is updated daily on week days.
Initial download of the metrics may take a while.