Fig. 6.
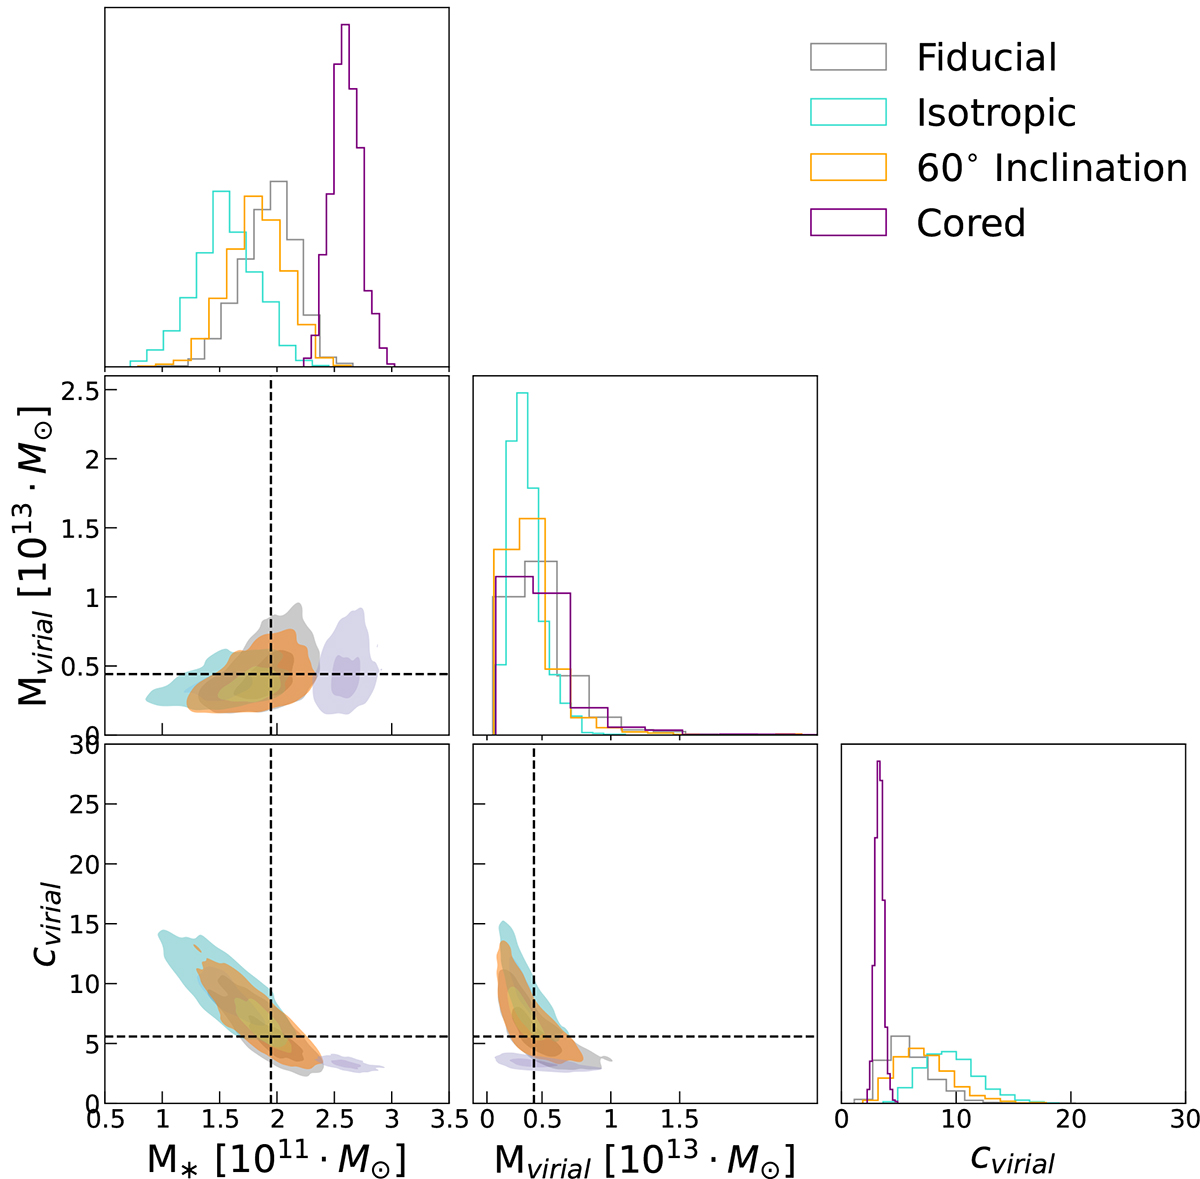
Download original image
One-and two-dimensional PDF distribution of the Mvir, M*, and cvir for the Fiducial model compared to the model variations discussed in Sect. 4.3. The PDF distributions for each model are shown in different colors: black for the Fiducial model, cyan for the “Isotropic model”, orange for the “60° inclination model”, and fuchsia for the “cored” model. The darker and lighter colors represent the 1 and 2-σ confidence intervals, respectively, for each model. The median value for the Fiducial model are shown in dashed black lines, and they are listed in Table 3 for the rest of the models.
Current usage metrics show cumulative count of Article Views (full-text article views including HTML views, PDF and ePub downloads, according to the available data) and Abstracts Views on Vision4Press platform.
Data correspond to usage on the plateform after 2015. The current usage metrics is available 48-96 hours after online publication and is updated daily on week days.
Initial download of the metrics may take a while.