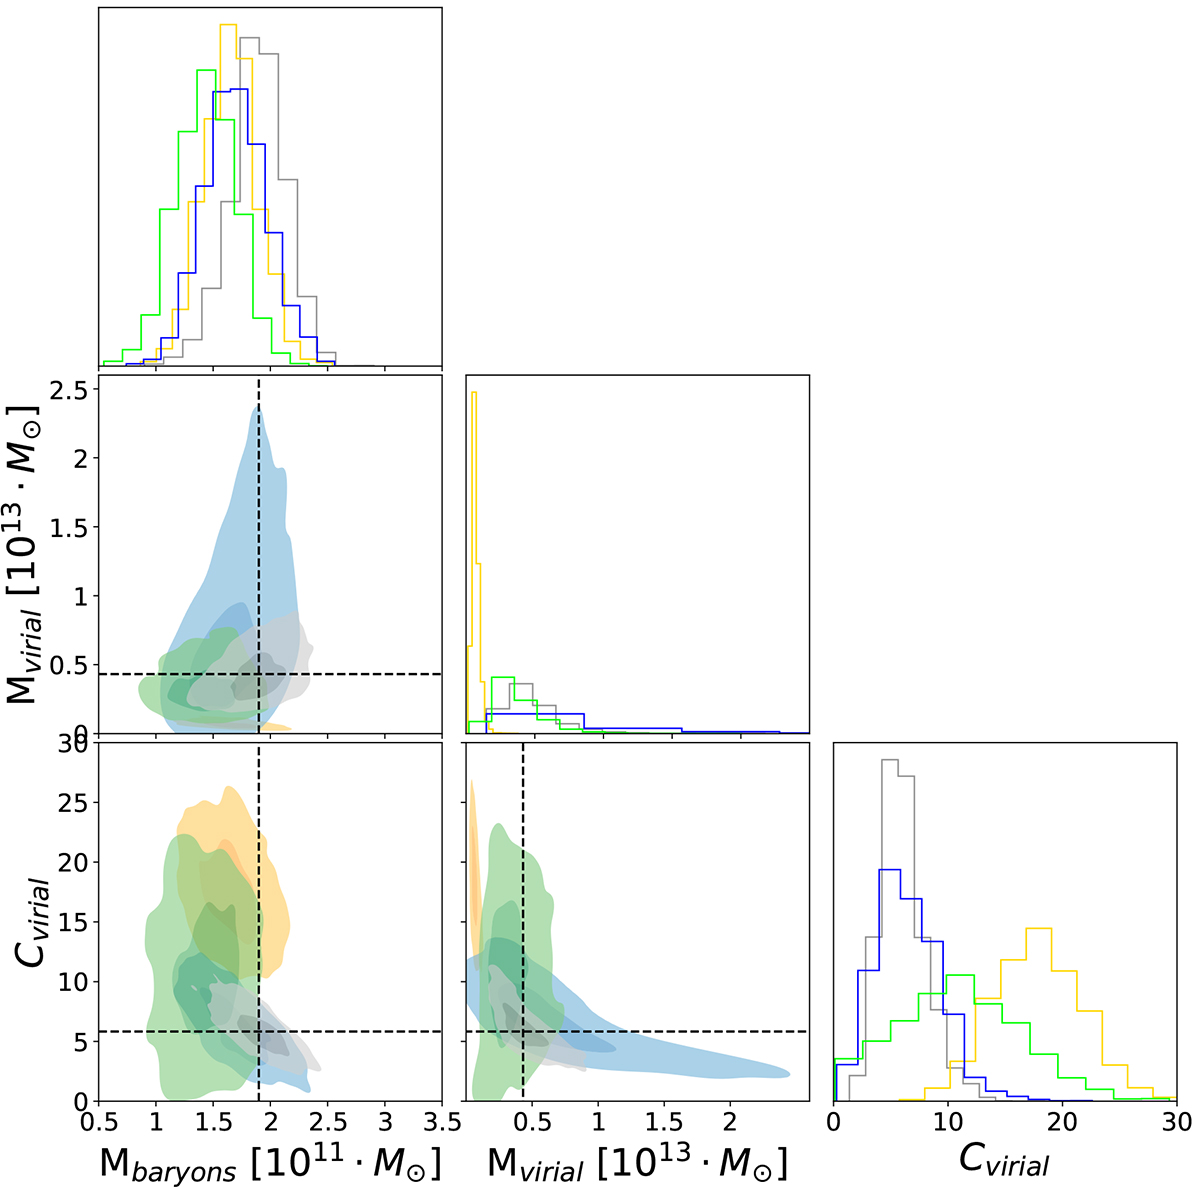
Fig. 5.
Download original image
One-and two-dimensional PDF of Mvir, cvir, and M* of the fiducial model compared to the PDF inferred from single-tracer anisotropic models. The blue PDF represents the GC-only model, the yellow PDF the PNe-only model, and the green PDF the dwarfs-only model. We represent 1-σ and 2-σ confidence intervals for each model with darker and lighter colors, respectively. The dashed lines show the median value for each quantity for the fiducial model, and they are the same as in Fig. 3 on the top.
Current usage metrics show cumulative count of Article Views (full-text article views including HTML views, PDF and ePub downloads, according to the available data) and Abstracts Views on Vision4Press platform.
Data correspond to usage on the plateform after 2015. The current usage metrics is available 48-96 hours after online publication and is updated daily on week days.
Initial download of the metrics may take a while.