Fig. 3.
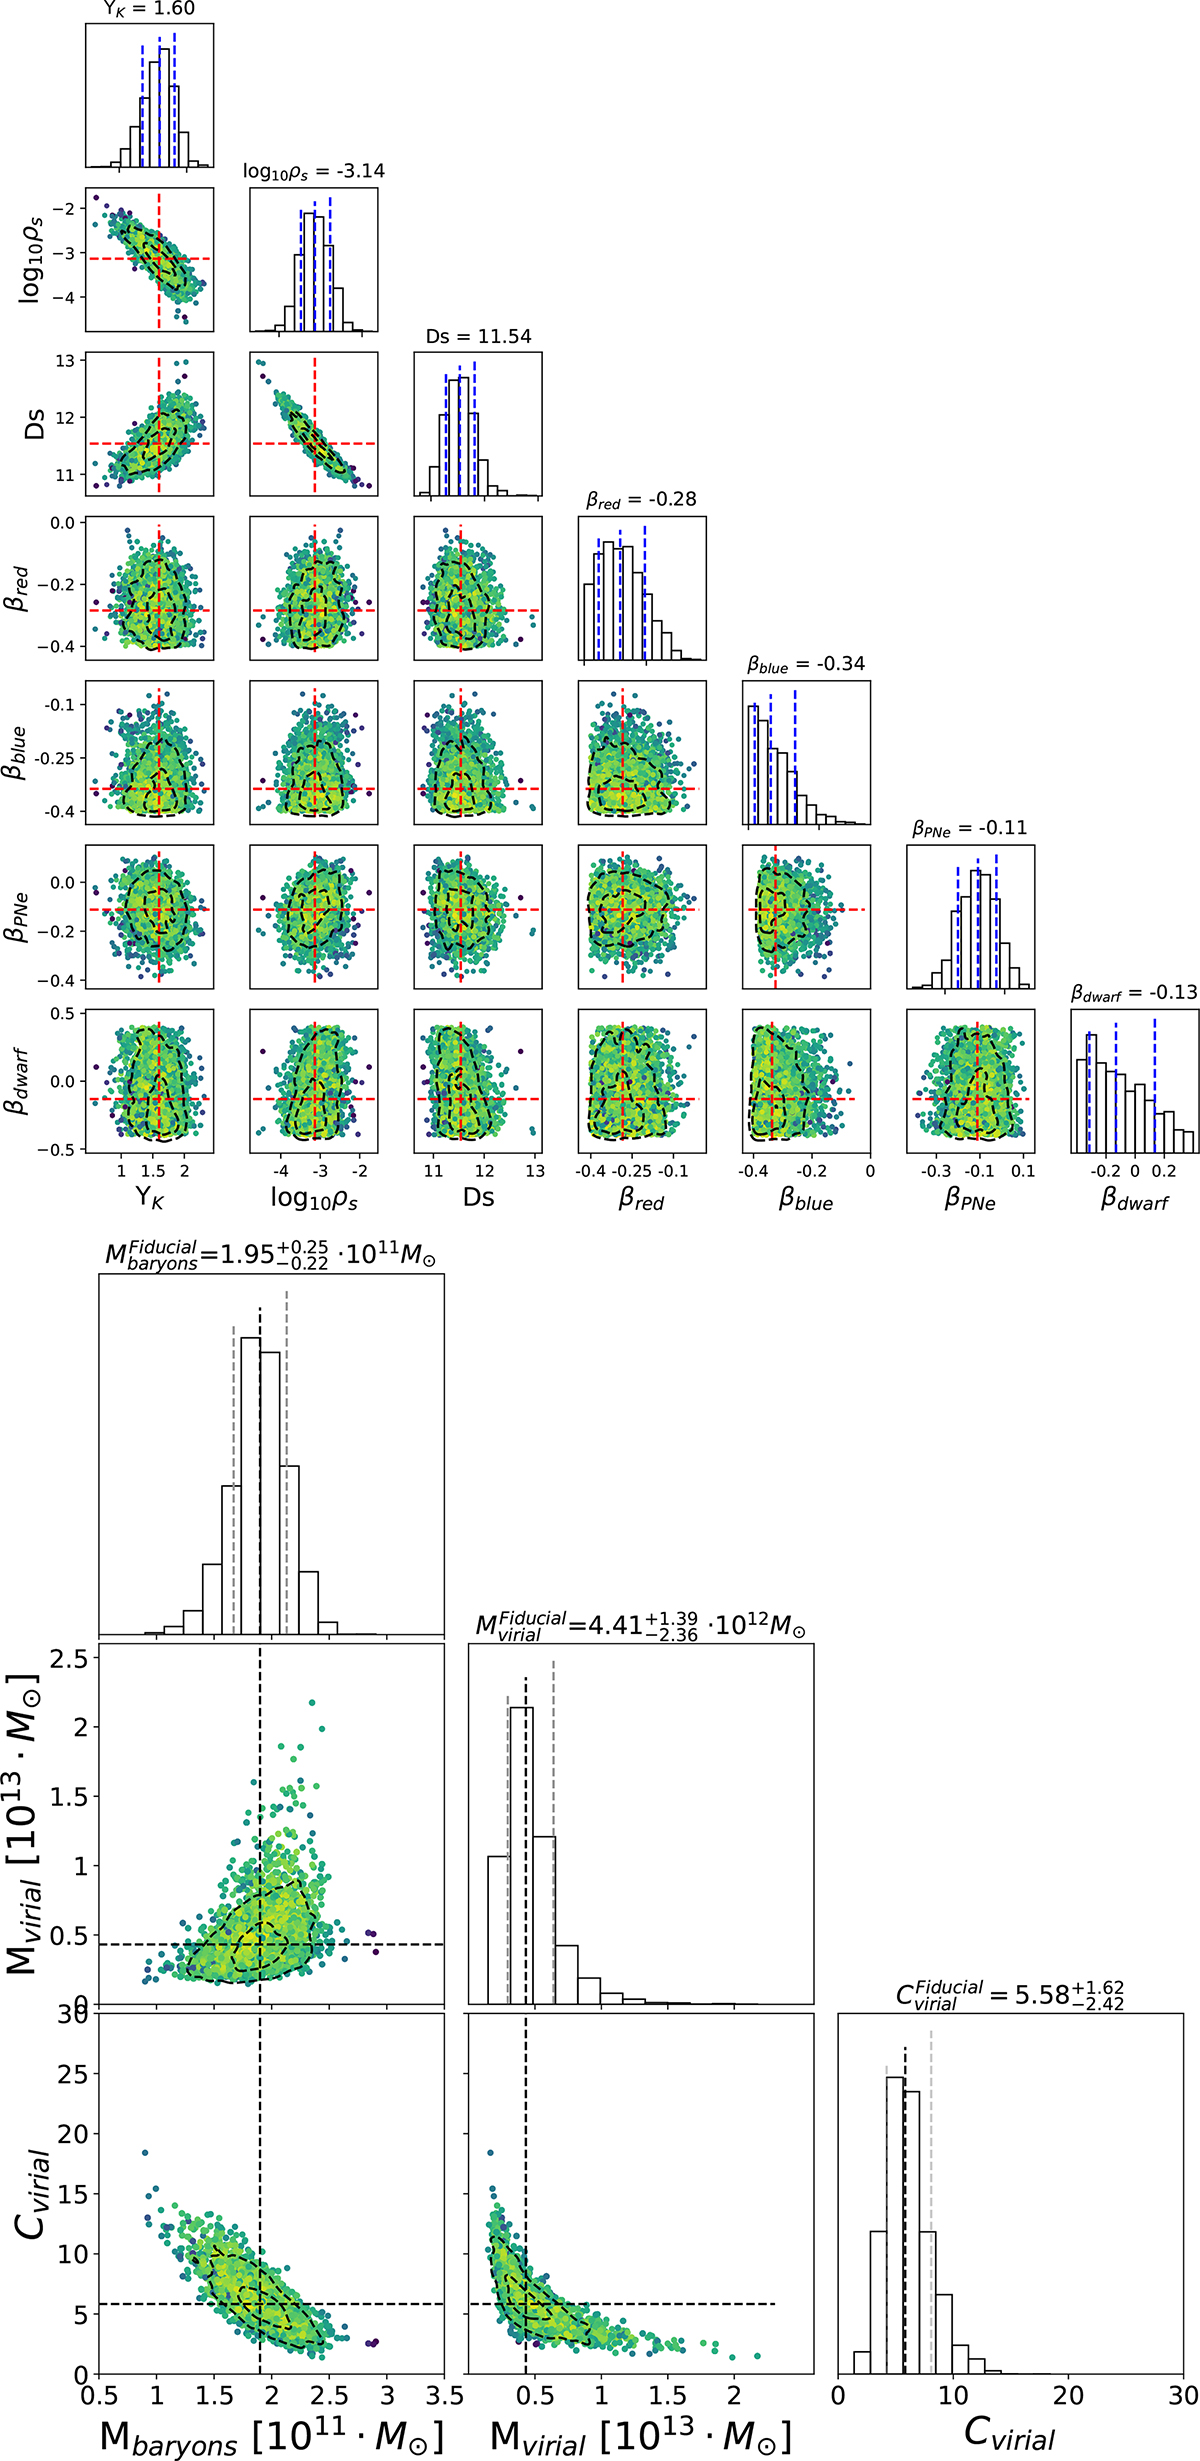
Download original image
Top: MCMC post-burn distribution for the seven free parameter of the fiducial model. The histograms show their marginalized PDF, and the vertical blue lines show their best-fit value and their 1-σ error. The scatter plots show the two-dimensional PDF for the parameters colored by log-likelihood, with yellow colors indicating higher values. The red-dashed lines indicate each parameter’s best-fit value (median) location, and the black-dashed contours show their 1-σ and 2-σ error. Bottom: plots show the one and two-dimensional PDF distribution for Mvir, M* and cvir. Lines and contours in this plot are the same as in the left panel, but all are shown here in black.
Current usage metrics show cumulative count of Article Views (full-text article views including HTML views, PDF and ePub downloads, according to the available data) and Abstracts Views on Vision4Press platform.
Data correspond to usage on the plateform after 2015. The current usage metrics is available 48-96 hours after online publication and is updated daily on week days.
Initial download of the metrics may take a while.