Fig. 6
Download original image
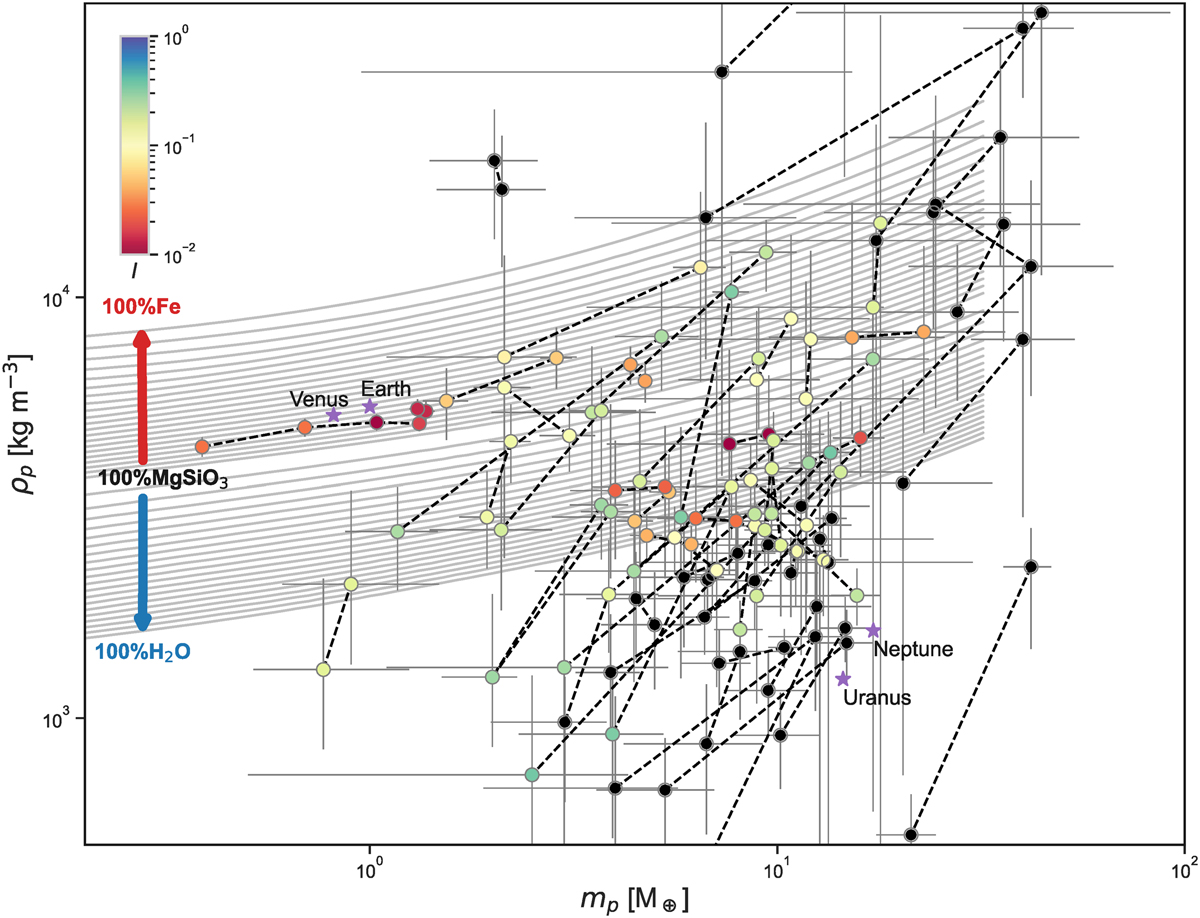
HCR sample on the mass-density diagram. The dots, connected by black dashed lines, are planet pairs that belong to this sample. The coloured dots represent those planets, for which we calculated interior distance I. The red colours indicate a pair of planets at a short interior distance, which means they are probably similar in the interior structure, and blue colours indicate planets that show larger separation in the interior from their neighbour. Light-grey curves represent the MRR interior curves calculated by Zeng et al. (2016). From the baseline of a silicate planet with 100% MgSiO3, the red points in the direction of increasing Fe content, and each curve represents a 10% increase in Fe content up to 100% Fe. Similarly, the blue arrow points in the direction of increasing water content at 10% increments per curve. Solar System planets are added for comparison and plotted as purple stars.
Current usage metrics show cumulative count of Article Views (full-text article views including HTML views, PDF and ePub downloads, according to the available data) and Abstracts Views on Vision4Press platform.
Data correspond to usage on the plateform after 2015. The current usage metrics is available 48-96 hours after online publication and is updated daily on week days.
Initial download of the metrics may take a while.