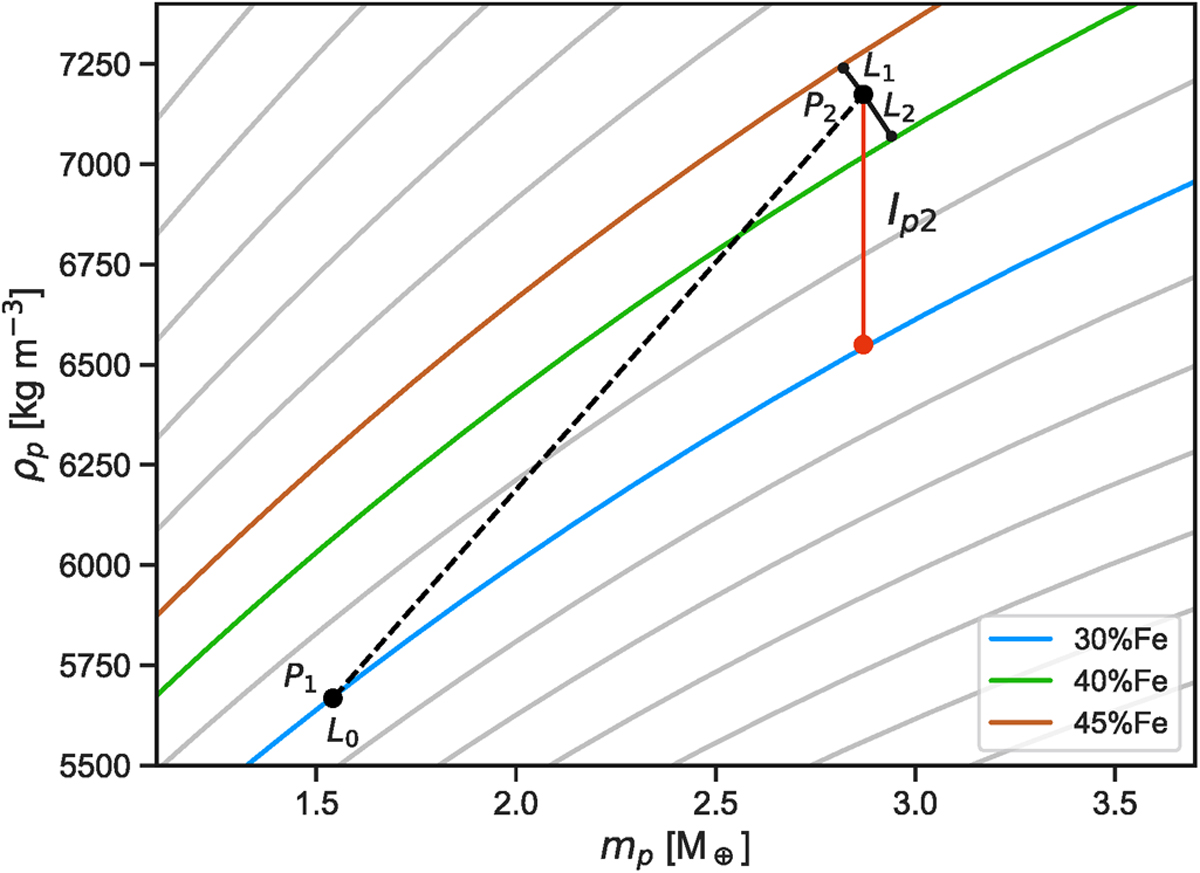
Fig. 5
Download original image
Interior difference between a pair of adjacent planets. In this illustrative example, planet P1 lies closest to the blue curve (distance L0) whereas planet P2 is closer to the red curve (distance L1). The blue curve, corresponding to 30% Fe and 70% MgSiO3, is chosen as the reference curve for the pair. This means if P2 had the same bulk composition as P1, P2’s bulk density should be given by the blue curve corresponding to its mass (red circle). Ip1 and Ip2 (shown in the thin red line) are measured as the vertical gap distance between planet P1 and planet P2 to the reference curve at their respective masses. This figure shows LTT 1445A b and c planets, and they are separated by an interior distance I = 0.053.
Current usage metrics show cumulative count of Article Views (full-text article views including HTML views, PDF and ePub downloads, according to the available data) and Abstracts Views on Vision4Press platform.
Data correspond to usage on the plateform after 2015. The current usage metrics is available 48-96 hours after online publication and is updated daily on week days.
Initial download of the metrics may take a while.