Fig. 2
Download original image
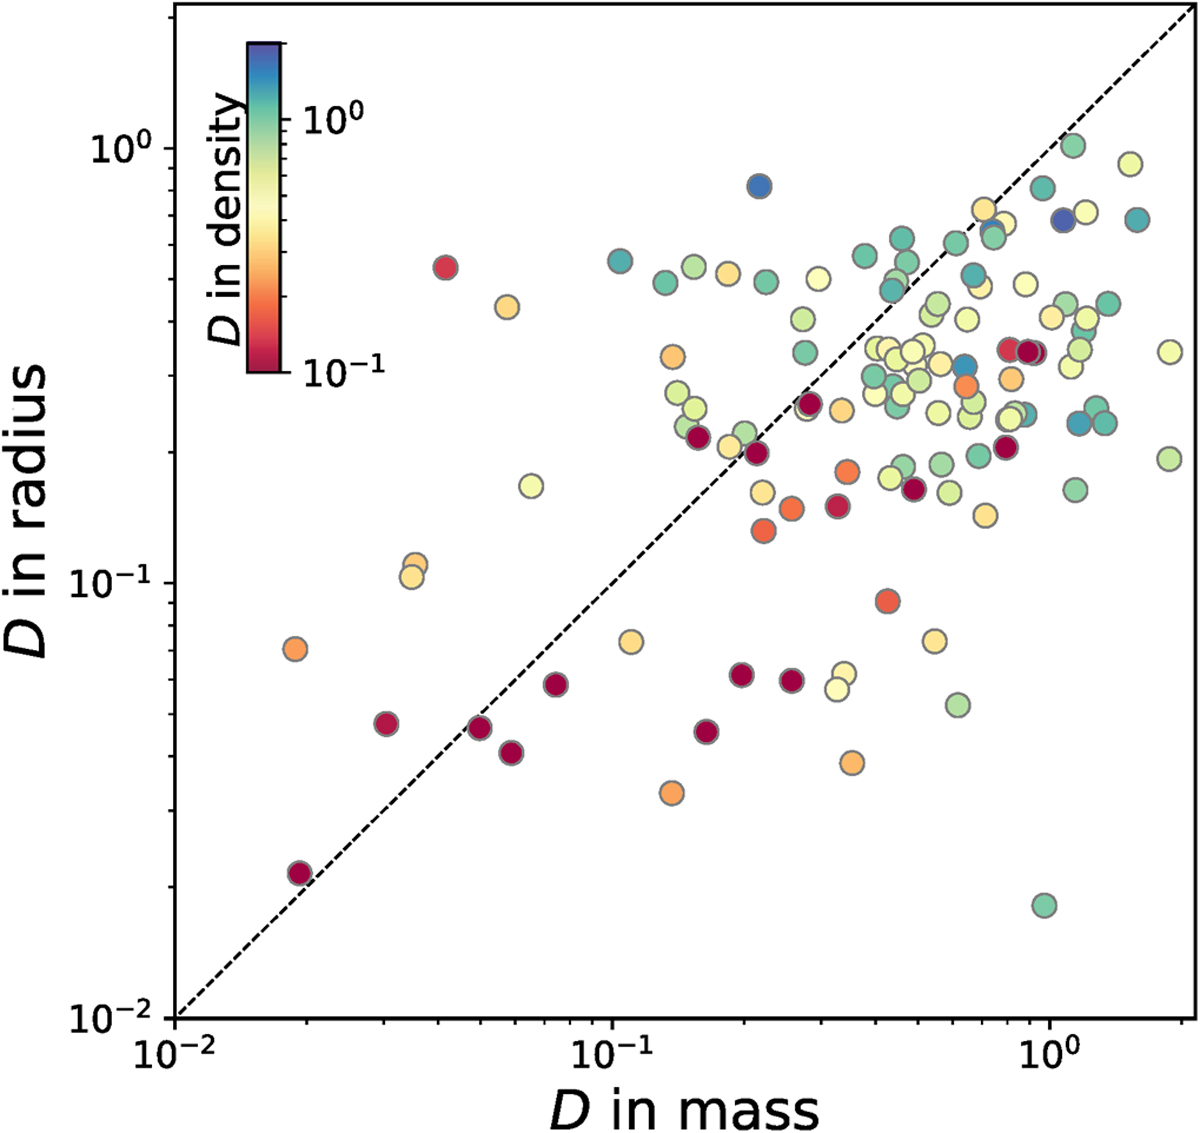
Intrasystem dispersion in mass, radius, and density. The x-axis shows dispersion in mass for systems in the main sample, the y-axis represents dispersion in radii, and the colour of the dots corresponds to dispersion in density. The red colours indicate similarity in density, and the blue colours indicate dissimilarity. The black dashed line is 1:1.
Current usage metrics show cumulative count of Article Views (full-text article views including HTML views, PDF and ePub downloads, according to the available data) and Abstracts Views on Vision4Press platform.
Data correspond to usage on the plateform after 2015. The current usage metrics is available 48-96 hours after online publication and is updated daily on week days.
Initial download of the metrics may take a while.