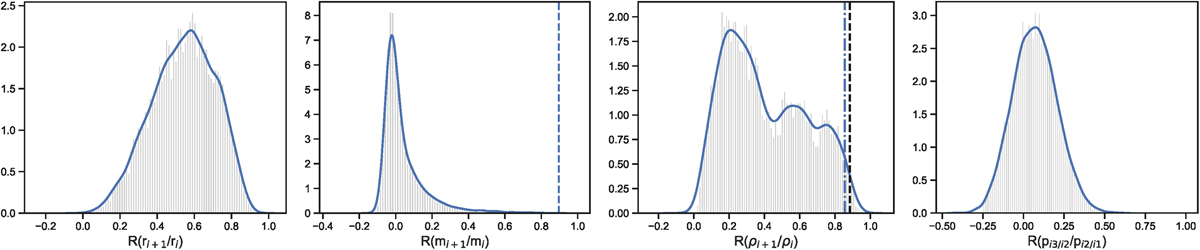
Fig. A.6
Download original image
Bootstrap test statistics. Each graph shows the Pearson coefficient distribution for parameter pairs for bootstrapping 40 planet pairs in 105 simulations. From left to right the correlation is calculated for radii, masses, densities of adjacent planets in pairs and period ratios in triples. In the “mass” graph the blue dashed line indicates the “high-correlated” subsample for planets around cool stars (2566-4398 K). In the “density” graph the blue dash-dotted and black dashed lines indicate the “high-correlated” subsamples for planets around stars with metallicity ([Fe/H] ∈[−0.210; −0.010]) and old stars (6.03-12.3 Gyr) respectively.
Current usage metrics show cumulative count of Article Views (full-text article views including HTML views, PDF and ePub downloads, according to the available data) and Abstracts Views on Vision4Press platform.
Data correspond to usage on the plateform after 2015. The current usage metrics is available 48-96 hours after online publication and is updated daily on week days.
Initial download of the metrics may take a while.