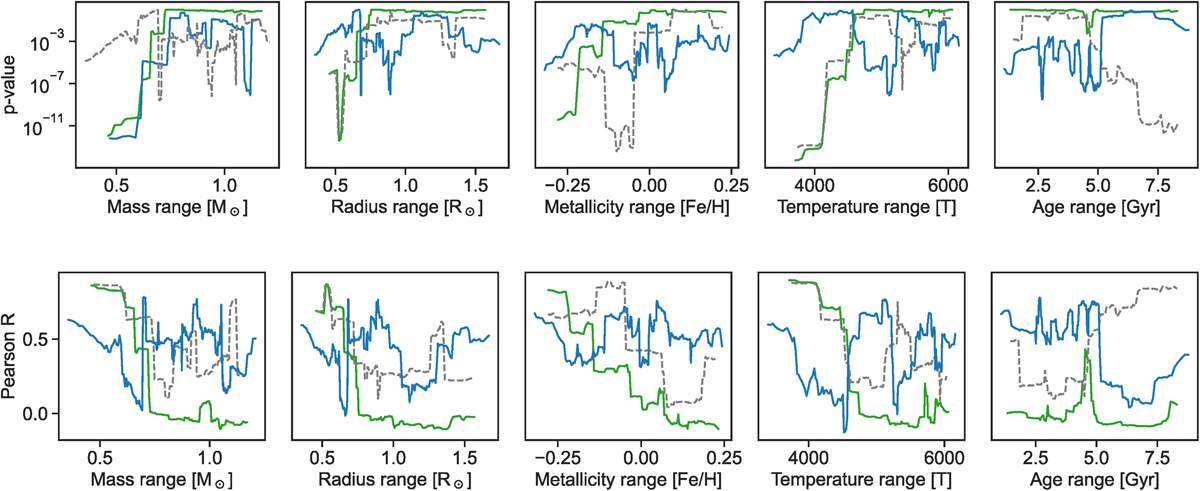
Fig. A.5
Download original image
Moving window test of the “40 data points” moving subsamples for masses (green line), radii (blue line), and densities (grey dashed line) of adjacent planets pairs. R and p-values from the repeated Pearson correlation analyses are plotted against ranges of stellar parameters. The values of the certain stellar parameter on the x-axis are calculated as the mean values for all planets in each subsample.
Current usage metrics show cumulative count of Article Views (full-text article views including HTML views, PDF and ePub downloads, according to the available data) and Abstracts Views on Vision4Press platform.
Data correspond to usage on the plateform after 2015. The current usage metrics is available 48-96 hours after online publication and is updated daily on week days.
Initial download of the metrics may take a while.