Fig. A.4
Download original image
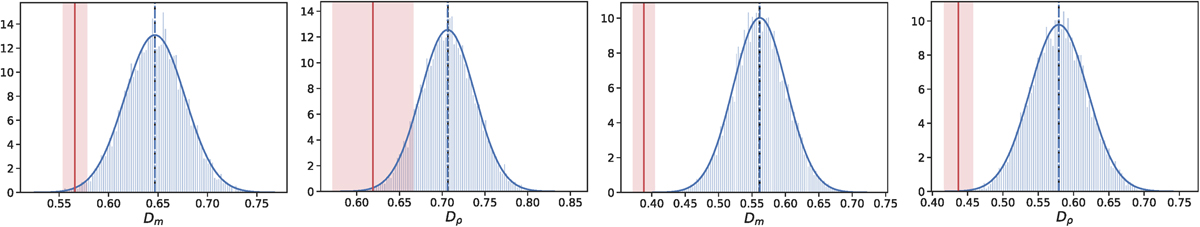
Expected dispersion from the non-parametric MRR (Ning et al. 2018) compared to dispersion in mass and density from the error-accommodation method. Red solid lines show intrasystem dispersion Derr and the corresponding standard deviation (light-red shadowed regions). From left to right the 105 random distributions from MRR are obtained for masses, and densities of adjacent planets in the main sample, and for masses, and densities of adjacent planets in the HCR sample. The blue dash-dotted and black dashed lines indicate mean and median values, respectively. The solid blue line indicates the best-fitted probability density function (PDF) of the normal distribution. The y-axis shows the probability density (the probability per unit on the x-axis).
Current usage metrics show cumulative count of Article Views (full-text article views including HTML views, PDF and ePub downloads, according to the available data) and Abstracts Views on Vision4Press platform.
Data correspond to usage on the plateform after 2015. The current usage metrics is available 48-96 hours after online publication and is updated daily on week days.
Initial download of the metrics may take a while.