Fig. A.2
Download original image
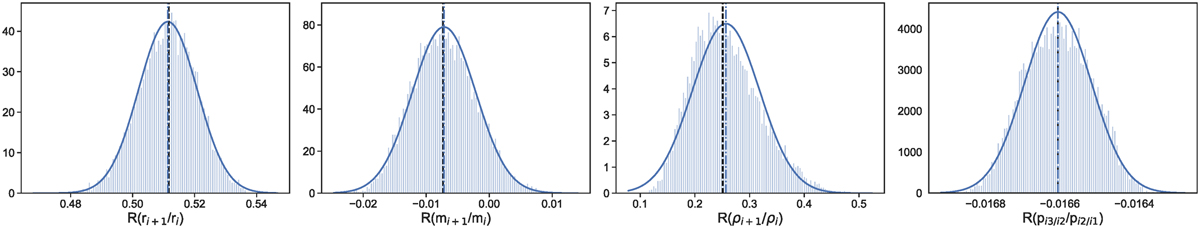
Pearson coefficients distributions from the error-accommodation method. Each graph shows R distribution for parameters of adjacent planets, which were tested for linear correlation by running 105 random uniform simulations. From left to right the correlation is calculated for radii, masses, densities of adjacent planets in pairs and period ratios in triples. The blue dash-dotted and black dashed lines indicate mean and median values, respectively. The solid blue line indicates the best-fitted probability density function (PDF) of the normal distribution. The y-axis shows the probability density (the probability per unit on the x-axis).
Current usage metrics show cumulative count of Article Views (full-text article views including HTML views, PDF and ePub downloads, according to the available data) and Abstracts Views on Vision4Press platform.
Data correspond to usage on the plateform after 2015. The current usage metrics is available 48-96 hours after online publication and is updated daily on week days.
Initial download of the metrics may take a while.