Fig. 1
Download original image
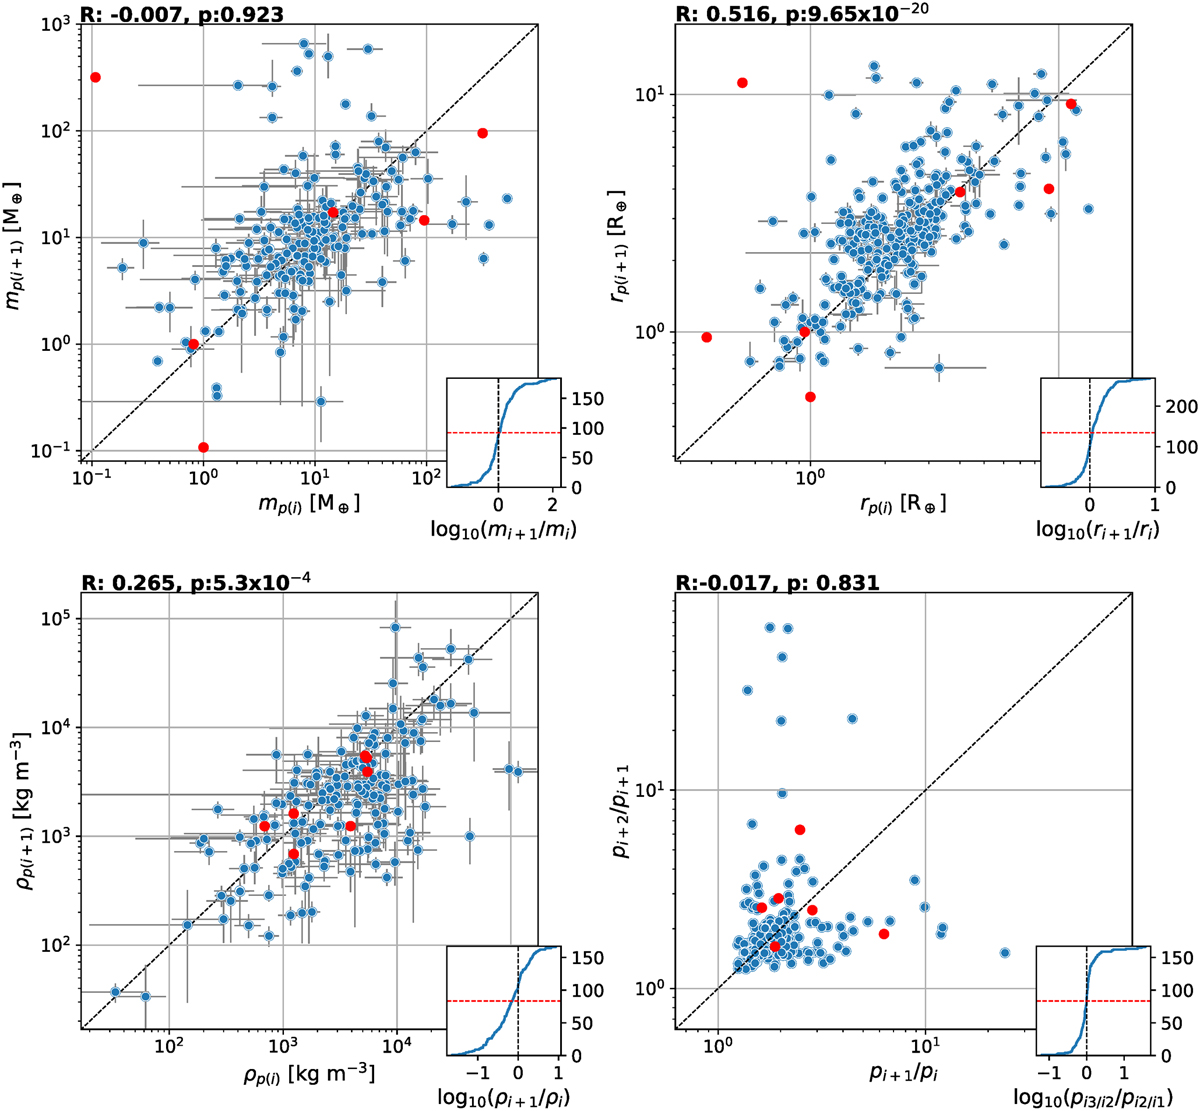
Masses, radii, densities, and period ratios of adjacent planets. The scatter graph for mass (top left), radius (top right), and density (bottom left) of a planet against the same parameter of the next planet farther from the star is plotted with observational errors indicated by the grey lines. The bottom right panel shows the period ratio between the middle and inner planet against that between the outer and middle planet in triples. The blue and red dot-shaped markers correspond to the sample and Solar System planet pairs, respectively. The black dashed line is the 1:1 line. The observational errors could be smaller than the marker size. In the bottom right corner of each plot, the cumulative distribution function is plotted for the decimal logarithm of each planet parameter ratio (x-axis) versus counts (y-axis). In these subplots, the black vertical dashed line is unity and the red horizontal dashed line is where the cumulative distribution function reaches the 50th percentile.
Current usage metrics show cumulative count of Article Views (full-text article views including HTML views, PDF and ePub downloads, according to the available data) and Abstracts Views on Vision4Press platform.
Data correspond to usage on the plateform after 2015. The current usage metrics is available 48-96 hours after online publication and is updated daily on week days.
Initial download of the metrics may take a while.