Fig. 6.
Download original image
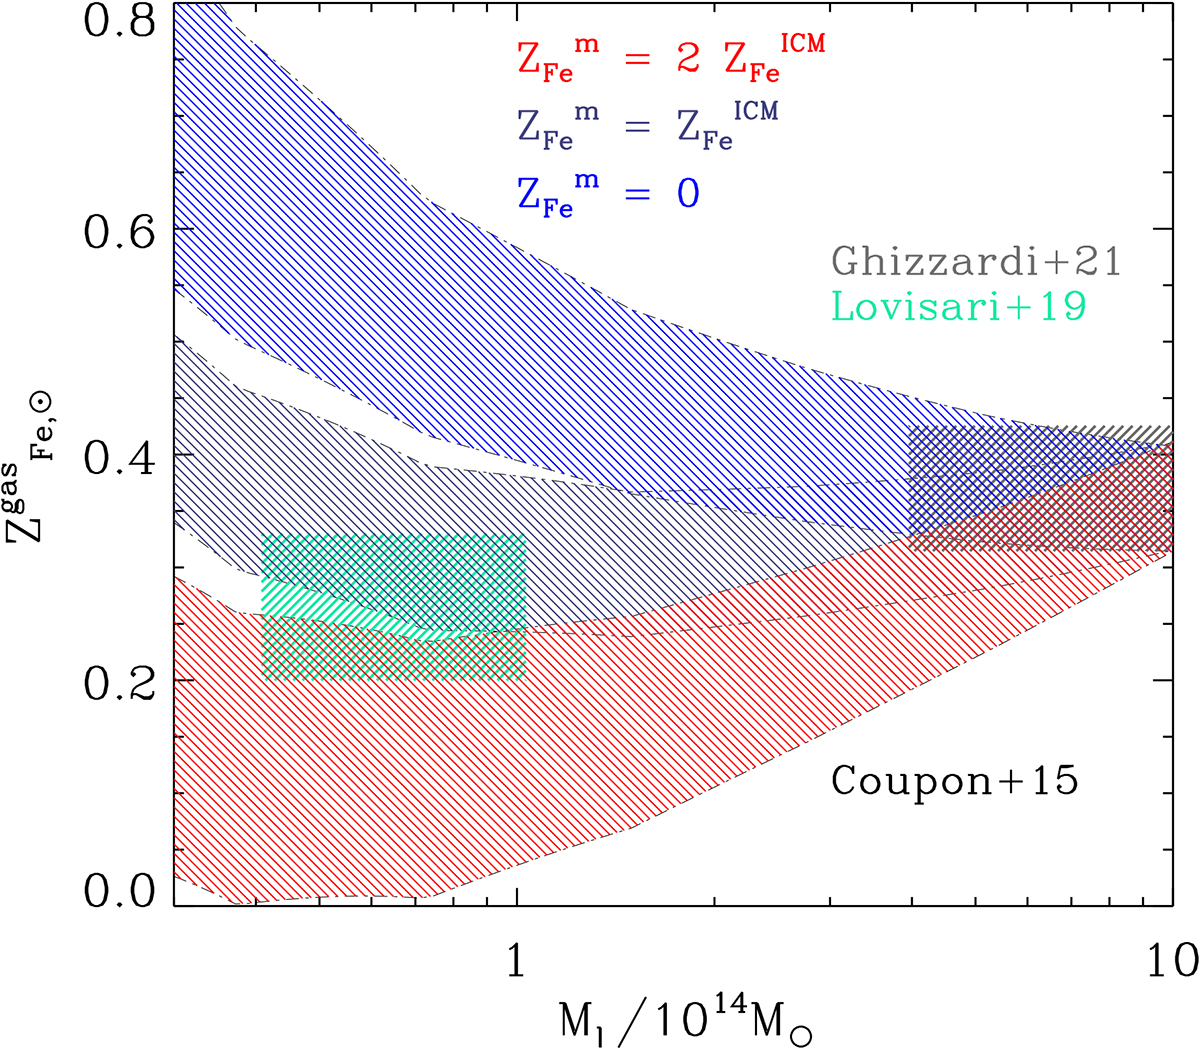
Fe abundance of hot gas in massive halos as a function of halo mass. Blue, gray, and red shaded regions represent predicted abundances for different values of the metallicity of the missing gas, they have all been derived using the SHMR reported in Coupon et al. (2015). Green and gray rectangles are measured abundances for groups and massive clusters, respectively.
Current usage metrics show cumulative count of Article Views (full-text article views including HTML views, PDF and ePub downloads, according to the available data) and Abstracts Views on Vision4Press platform.
Data correspond to usage on the plateform after 2015. The current usage metrics is available 48-96 hours after online publication and is updated daily on week days.
Initial download of the metrics may take a while.