Fig. 4.
Download original image
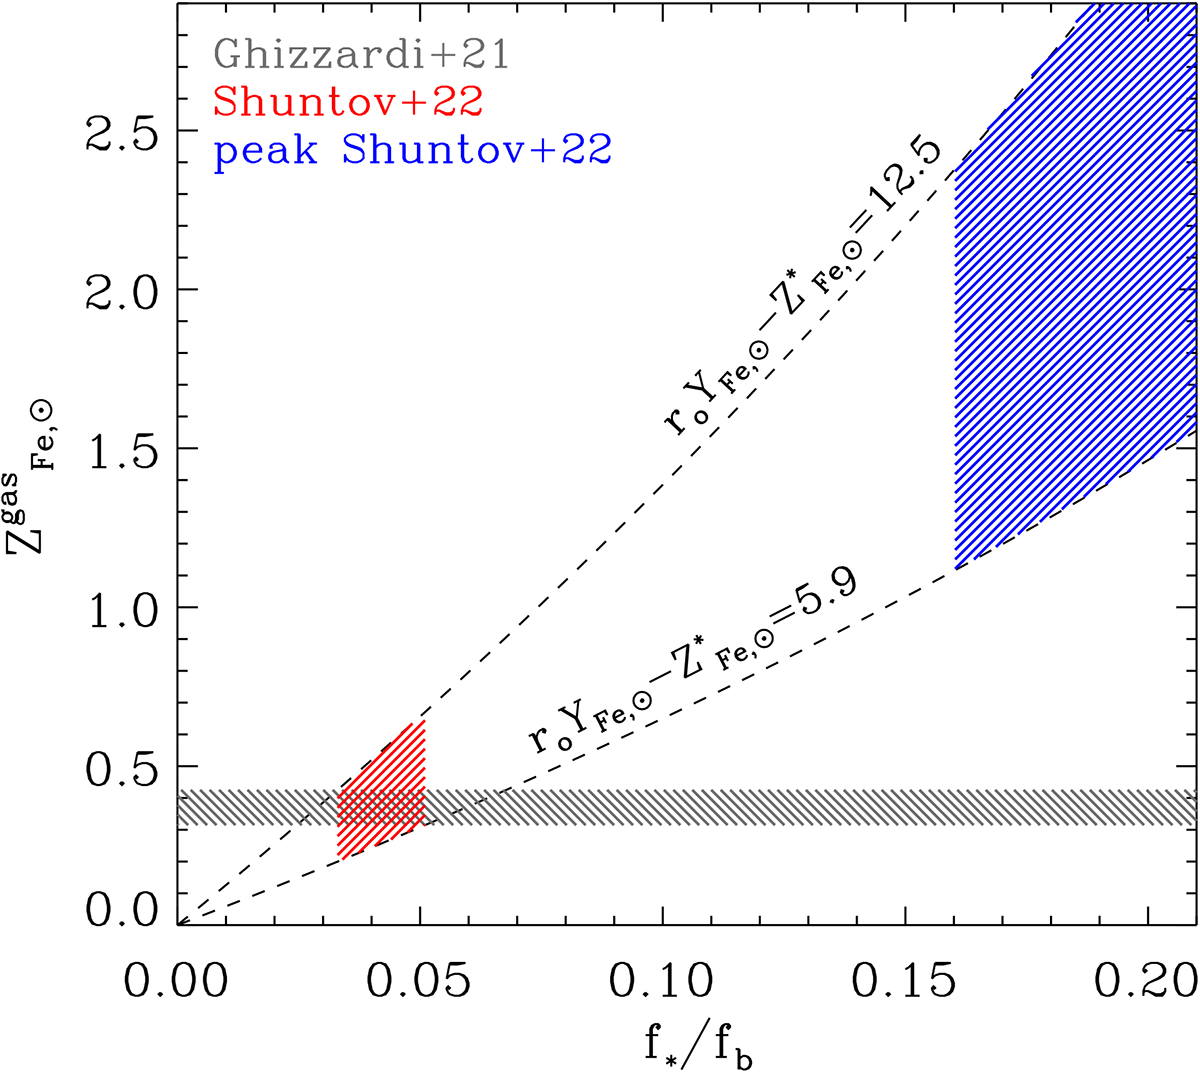
Gas Fe abundance as a function of stellar over baryon fraction. The shaded gray region represents the Fe abundance measurements for massive clusters. The red shaded region shows where f⋆/fb values for massive systems, as reported by Shuntov et al. (2022), are consistent with Fe abundance measurements. The shaded blue region shows how constraints on ![]() allow us to estimate Fe abundance for ∼1012 M⊙ halos from the value of the peak stellar fraction, as measured by Shuntov et al. (2022).
allow us to estimate Fe abundance for ∼1012 M⊙ halos from the value of the peak stellar fraction, as measured by Shuntov et al. (2022).
Current usage metrics show cumulative count of Article Views (full-text article views including HTML views, PDF and ePub downloads, according to the available data) and Abstracts Views on Vision4Press platform.
Data correspond to usage on the plateform after 2015. The current usage metrics is available 48-96 hours after online publication and is updated daily on week days.
Initial download of the metrics may take a while.