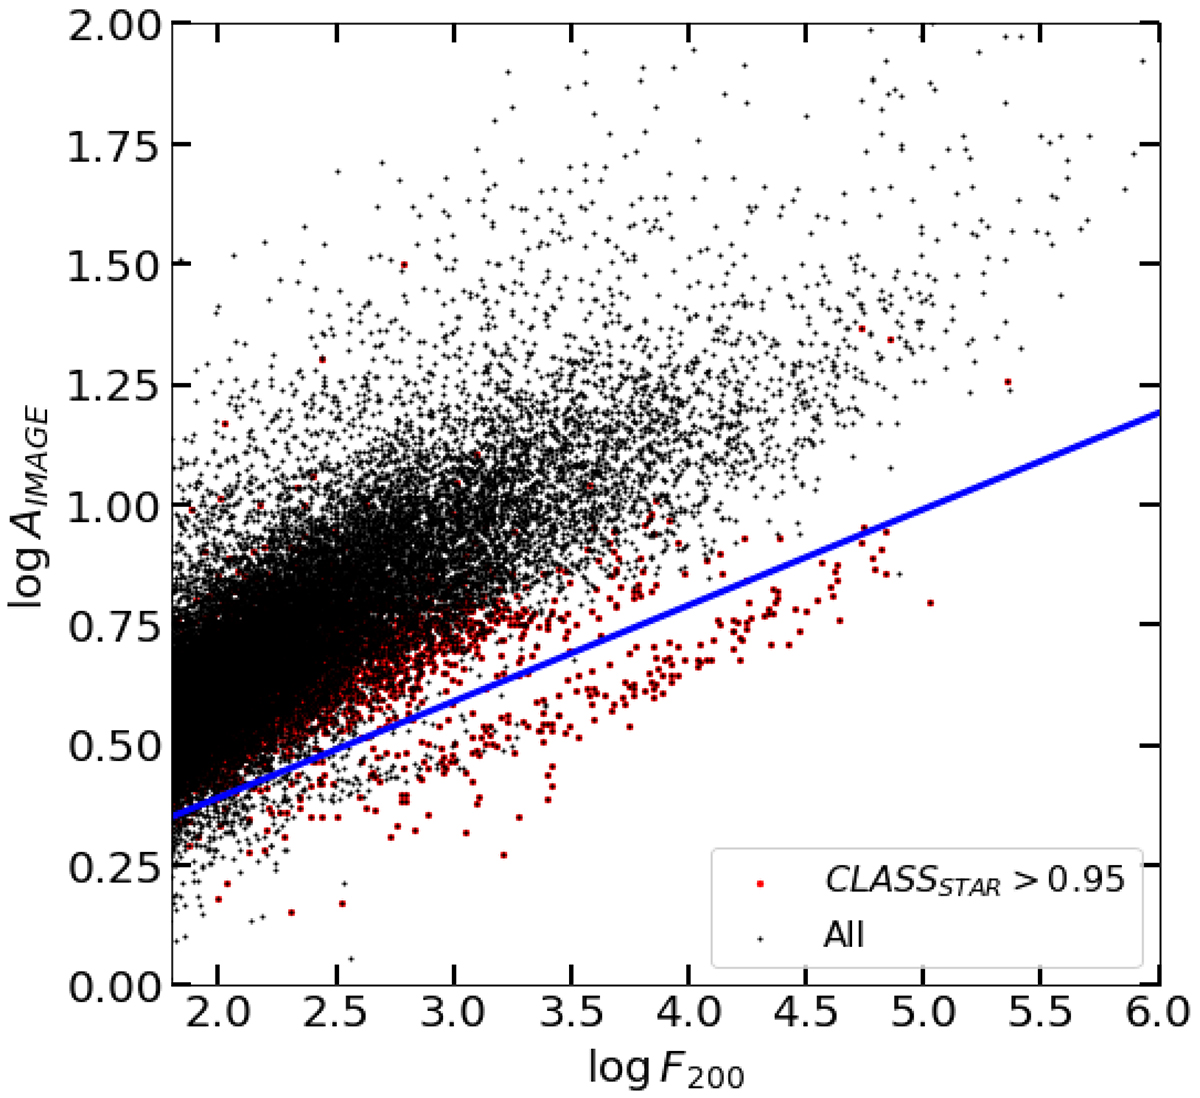
Fig. A.1.
Download original image
Log F200 − Log AIMAGE plane used in this work for star-galaxy separation. The black dots show all the sample of selected objects with F200W AB apparent magnitude smaller than 27. The red points are those objects with a value of CLASSSTAR > 0.95. The blue solid line show the boundary used to separate stars (below the line) from galaxies (above the line).
Current usage metrics show cumulative count of Article Views (full-text article views including HTML views, PDF and ePub downloads, according to the available data) and Abstracts Views on Vision4Press platform.
Data correspond to usage on the plateform after 2015. The current usage metrics is available 48-96 hours after online publication and is updated daily on week days.
Initial download of the metrics may take a while.